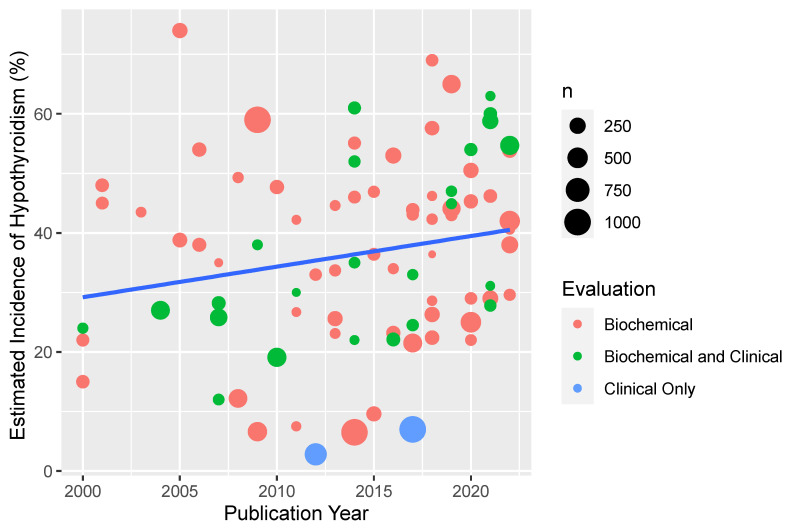
Figure 2.
Estimated incidence of RT-related hypothyroidism for included studies displayed over time by year of publication. Each dot represents a study, with size weighted according to the sample size of patients reported in the publication. The color of the dot reflects the method of thyroid function evaluation. Note: studies published before 2010 were excluded from this figure to improve clarity. Studies using radiographic evaluation of the thyroid gland also included biochemical evaluation and were considered as “biochemical” in the figure.

