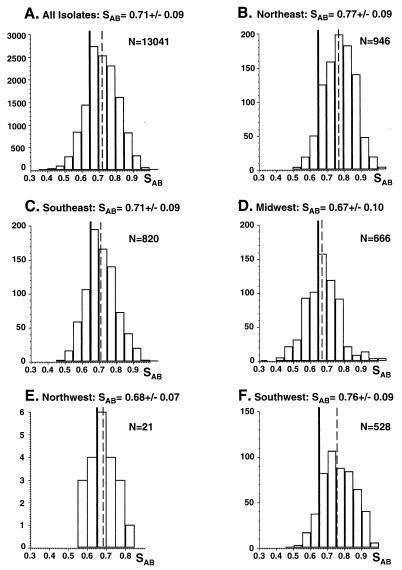
FIG. 3.
Distributions, average SABs, and number of pairwise comparisons (N) of all isolates (A), NE isolates (B), SE isolates (C), MW isolates (D), NW isolates (E), and SW isolates (F). SABs are presented as average ± standard deviation. The solid vertical line notes the average SAB computed for unrelated isolates (20). Dashed vertical lines note the average SAB of each respective collection.

