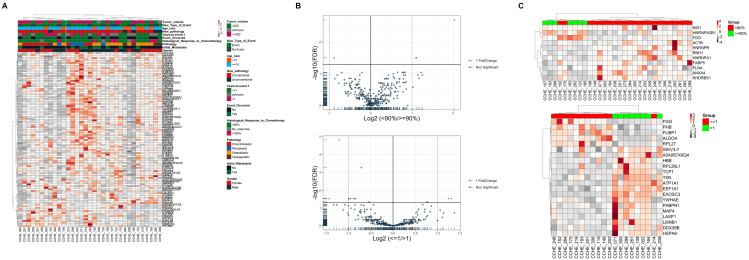
Figure 2.
Clinical features do not affect the proteome signature of osteosarcoma patients. (A) Heat map and hierarchical clustering based on the total proteome identified. (B) Volcano plots of all proteins significantly altered by the (top) histological response to chemotherapy and (bottom) years-to-event (log2-fold-change threshold = 1, Benjamini–Hochberg corrected p-value threshold = 0.1). (C) Heat map and hierarchical clustering based on the top 20 genes differentiated between groups of (top) Histological response to chemotherapy and (bottom) years-to-event. Heat map colors are based on the z-scored (log2) intensity values. Grey and red correspond to decreased and increased expression levels, respectively.

