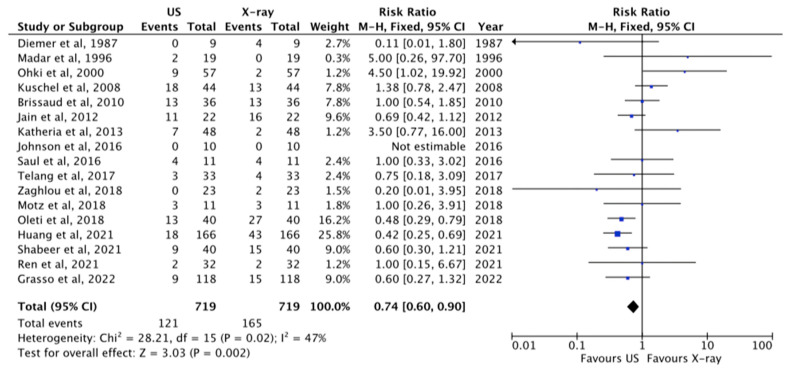
Figure 3.
Correct tip position at US and X-ray [1,11,21,22,23,24,25,26,28,29,30,31,32,33,34,35,37]. The central area of the diamond represents the total result of the Meta-analysis; the extremities of the diamond show the CI and the blue square evidenced the amount of the sample reported for each author. The arrow means that the sample size for this paper go beyond the scale used in this figure.

