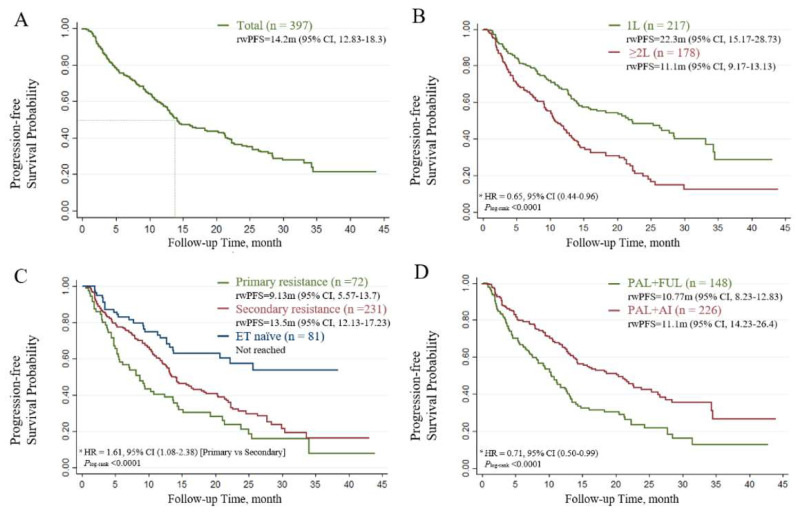
Figure 1.
The Kaplan–Meier curves of progression-free survival in patients treated with PAL. (A) Survival outcomes of the entire population. (B) Patients receiving different lines of therapy (LoT). (C) Patients with different sensitivity statuses. (D) Patients receiving different combinations of therapies. HR, hazard ratio *; rwPFS, real-world progression-free survival. * Hazard ratios were estimated using multivariate Cox regression models adjusted for baseline demographic and clinical variables.

