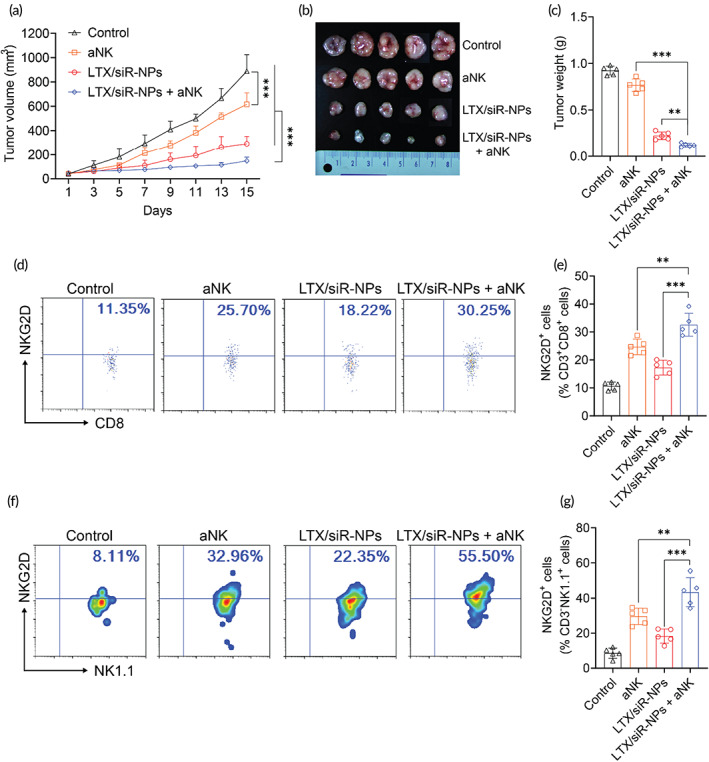
FIGURE 5.

The synergic antitumor efficacy of LTX/siR‐NPs and NKG2A blockade. (a) Tumor volume of 4T1 tumor‐bearing mice treated with PBS (control), anti‐NKG2A antibody (aNK), LTX/siR‐NPs, and LTX/siR‐NPs + aNK with increasing time. (b) Images and (c) weight of 4T1 tumor isolated from treated mice. (d–g) Flow cytometric and data analysis of NKG2D expression in intratumoral CD8+ and NK cells. Data represented as mean ± SD (n = 5). Two‐way ANOVA (a) and one‐way ANOVA (c, e, g) with Tukey's multiple comparison test, *p < 0.05; **p < 0.01; ***p < 0.001
