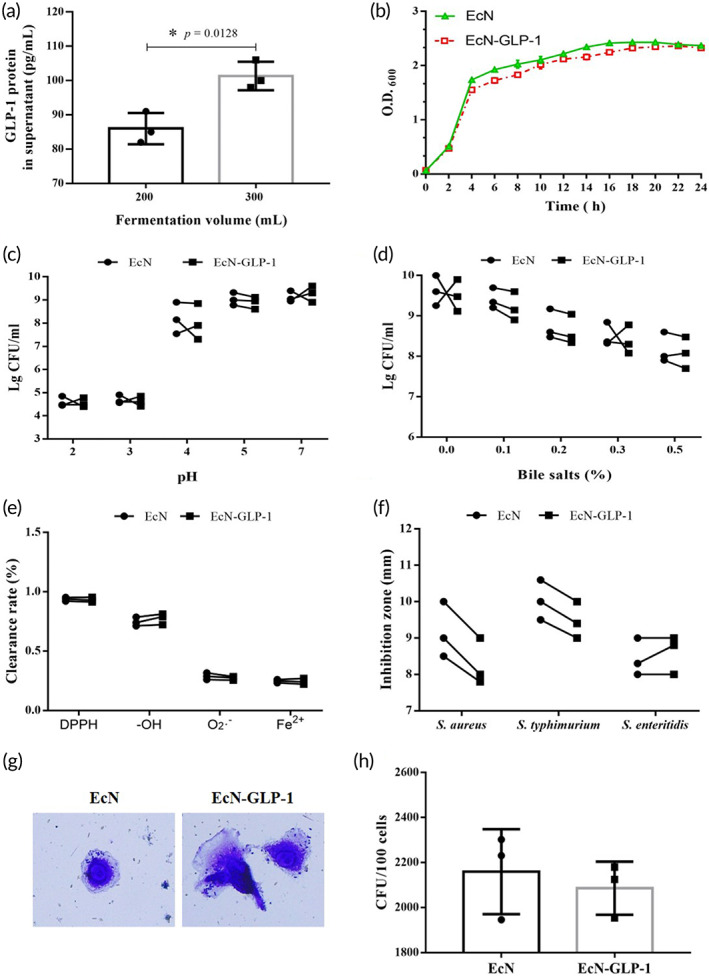
FIGURE 1.

Expression of GLP‐1 in the engineered probiotic strain and evaluation its probiotic characteristics. (a) ELISA analysis of EcN‐GLP‐1 expressing and secreting GLP‐1. (b) Growth curves of EcN‐GLP‐1 and EcN. (c) Acid tolerance capacity of EcN‐GLP‐1 and EcN. (d) Bile salt resistance of EcN‐GLP‐1 and EcN. (e) Antioxidant property of EcN‐GLP‐1 and EcN. (f) Antibacterial activity of EcN‐GLP‐1 and EcN. (g) Representative diagram of EcN‐GLP‐1 and EcN adhesion CT26 cells. (h) The CFU of adherent bacteria per 100 CT26 cells. Means ± SD was calculated from three independent experiments. Compared with EcN, *p < 0.05, no asterisk indicates no significant difference (p > 0.05)
