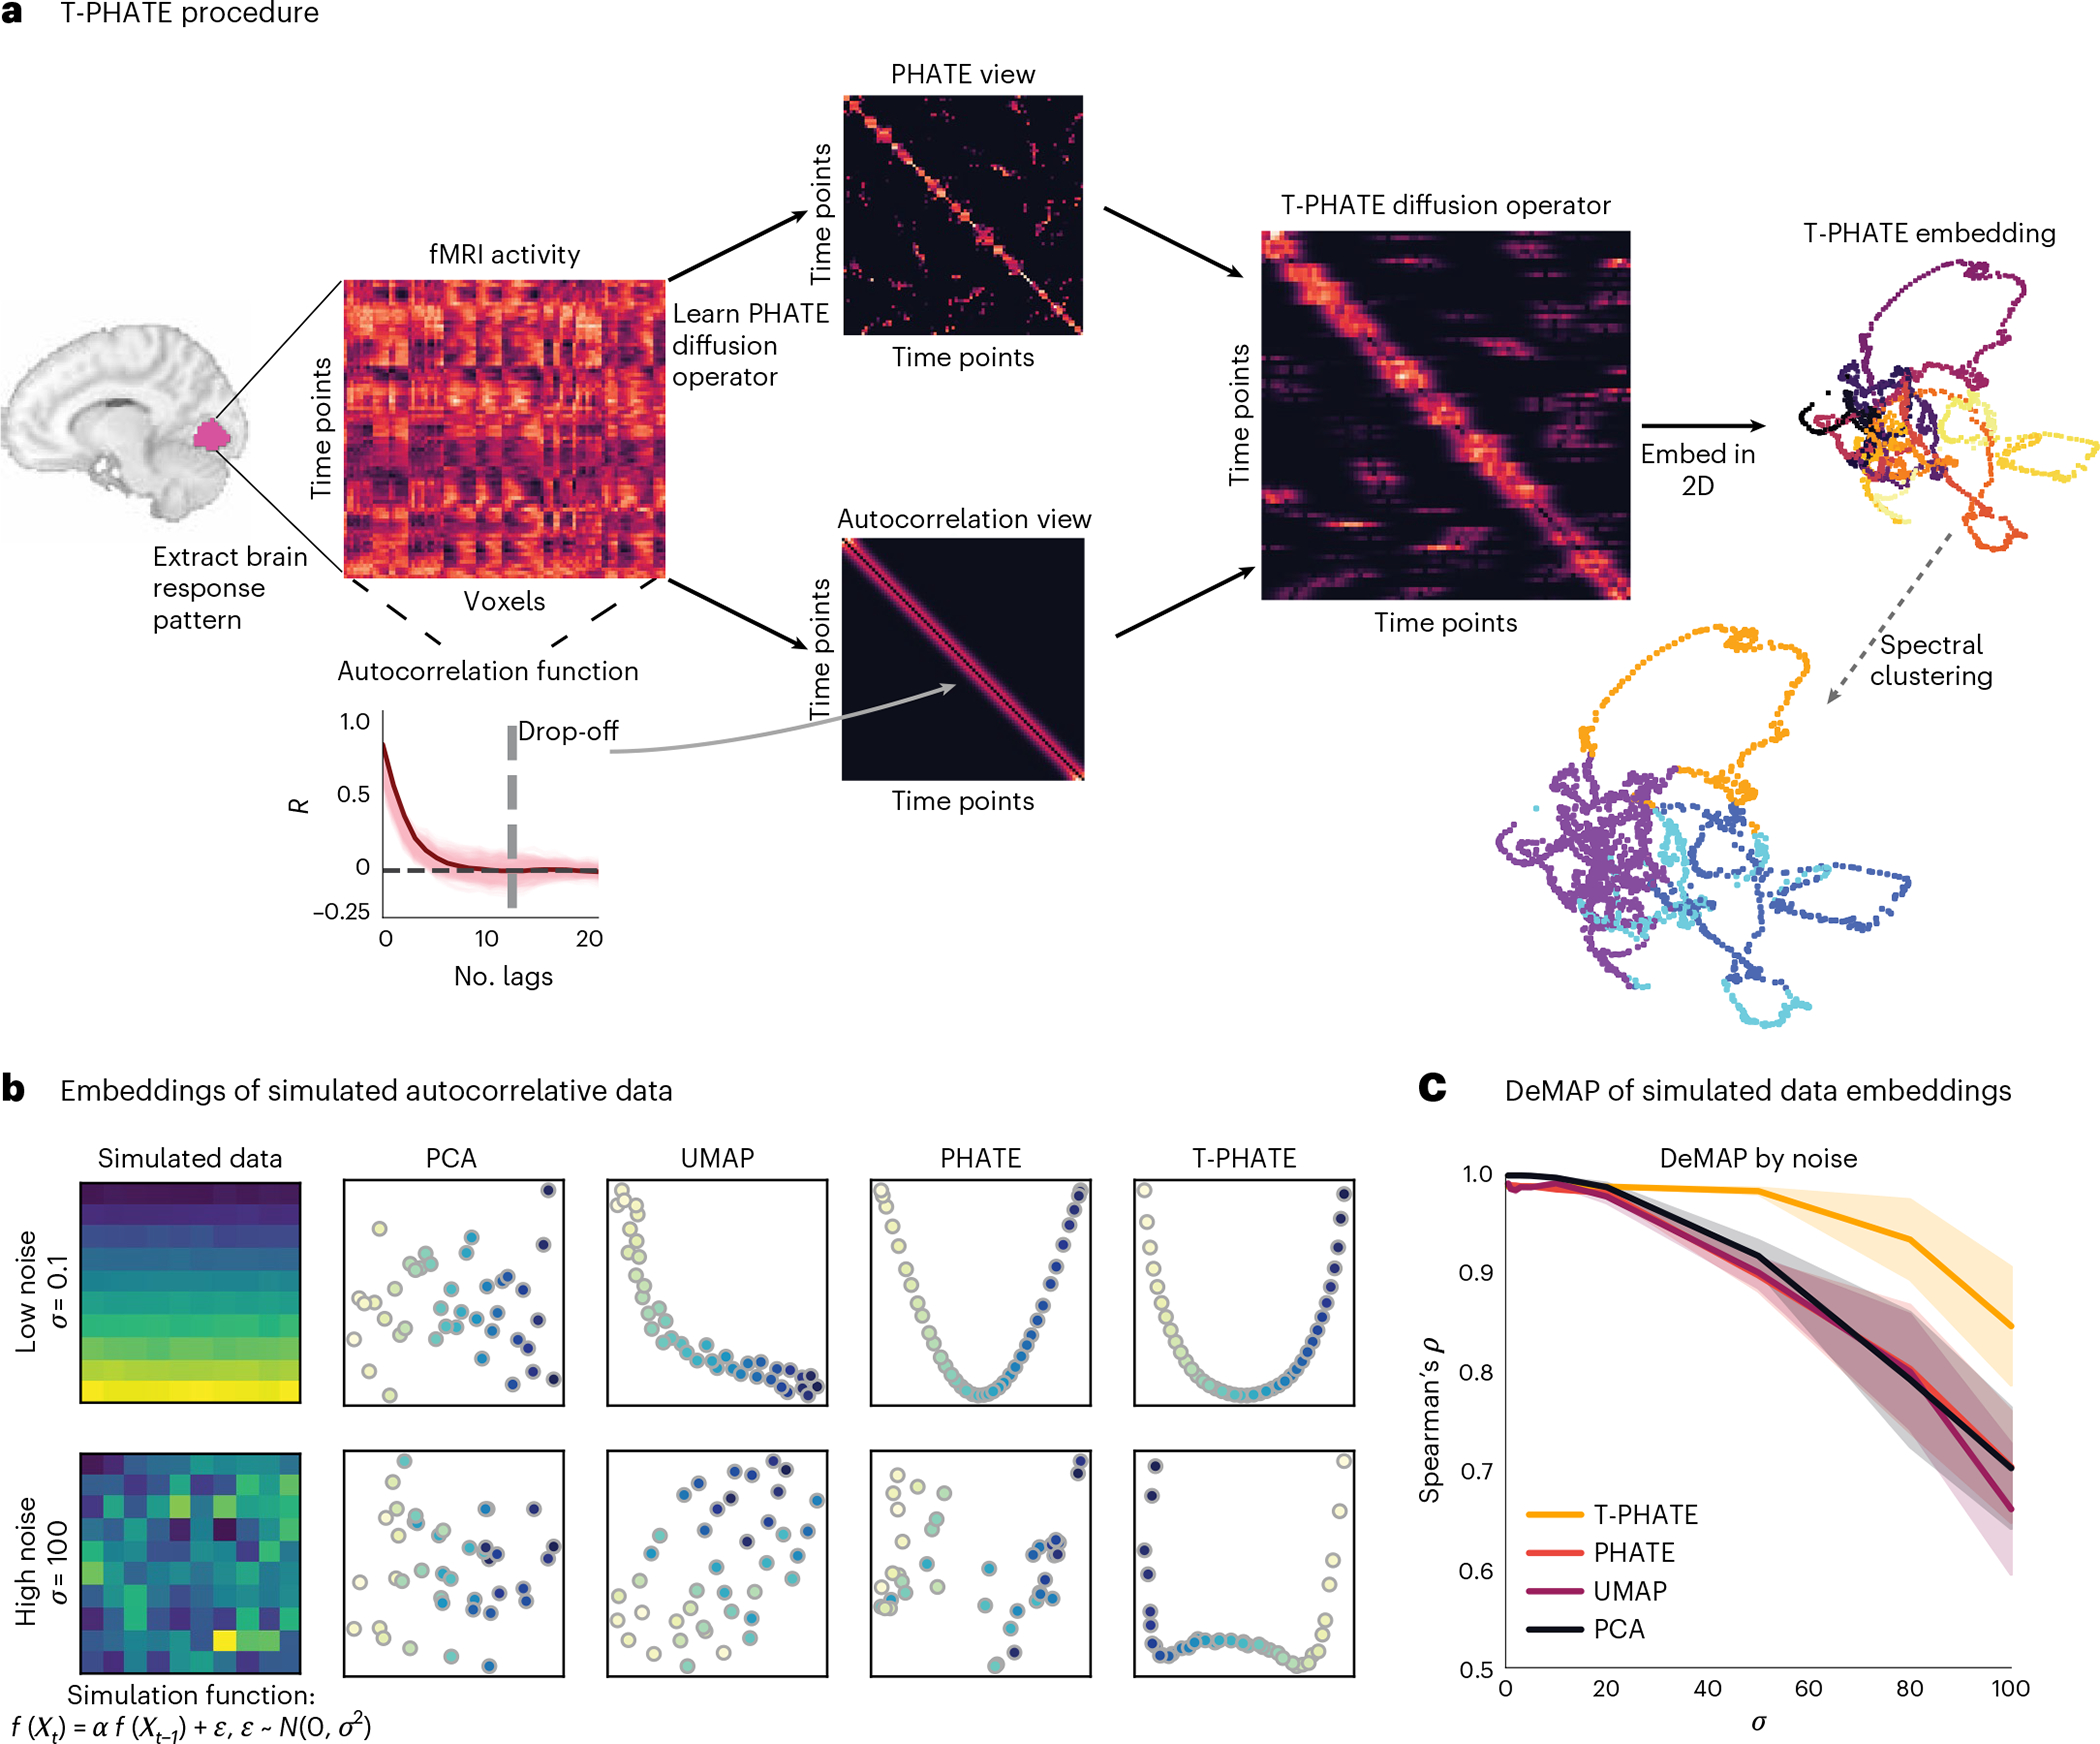
Fig. 1 |. T-PHATE procedure.

a, A multivariate pattern of fMRI activation over time (time points by voxels) is extracted from a region of interest (ROI). PHATE is then run to learn a PHATE-based affinity matrix between time points. The autocorrelation function is also estimated for the data separately to make an autocorrelation-based affinity matrix. These two views are combined into the T-PHATE diffusion operator and then embedded into lower dimensions. b,c, We tested this approach on simulated data with a known autocorrelative function. To do this, we took a matrix of pristine data (here, a simulated multivariate time-series in which and added noise sampled from a normal distribution to each sample of pristine data. We tested various values of from 0 to 100 (c, x-axis) and compared the fidelity of the manifold distances recovered by each embedding as a function of the amount of noise added to the input data using DeMAP28. We show two sample input matrices (b, far left) to the DeMAP analysis for noise sampled from a narrow distribution (top row, and noise sampled from the widest distribution (bottom row; . T-PHATE both visually better reconstructs the autocorrelative signal from the noise (b) and quantitatively better preserves manifold distances (c) compared with PCA, UMAP, and PHATE. The error bands in c represent the 90% confidence interval of the mean DeMAP score from 1,000 bootstrap iterations. See Supplementary Fig. 1a for more benchmarks.
