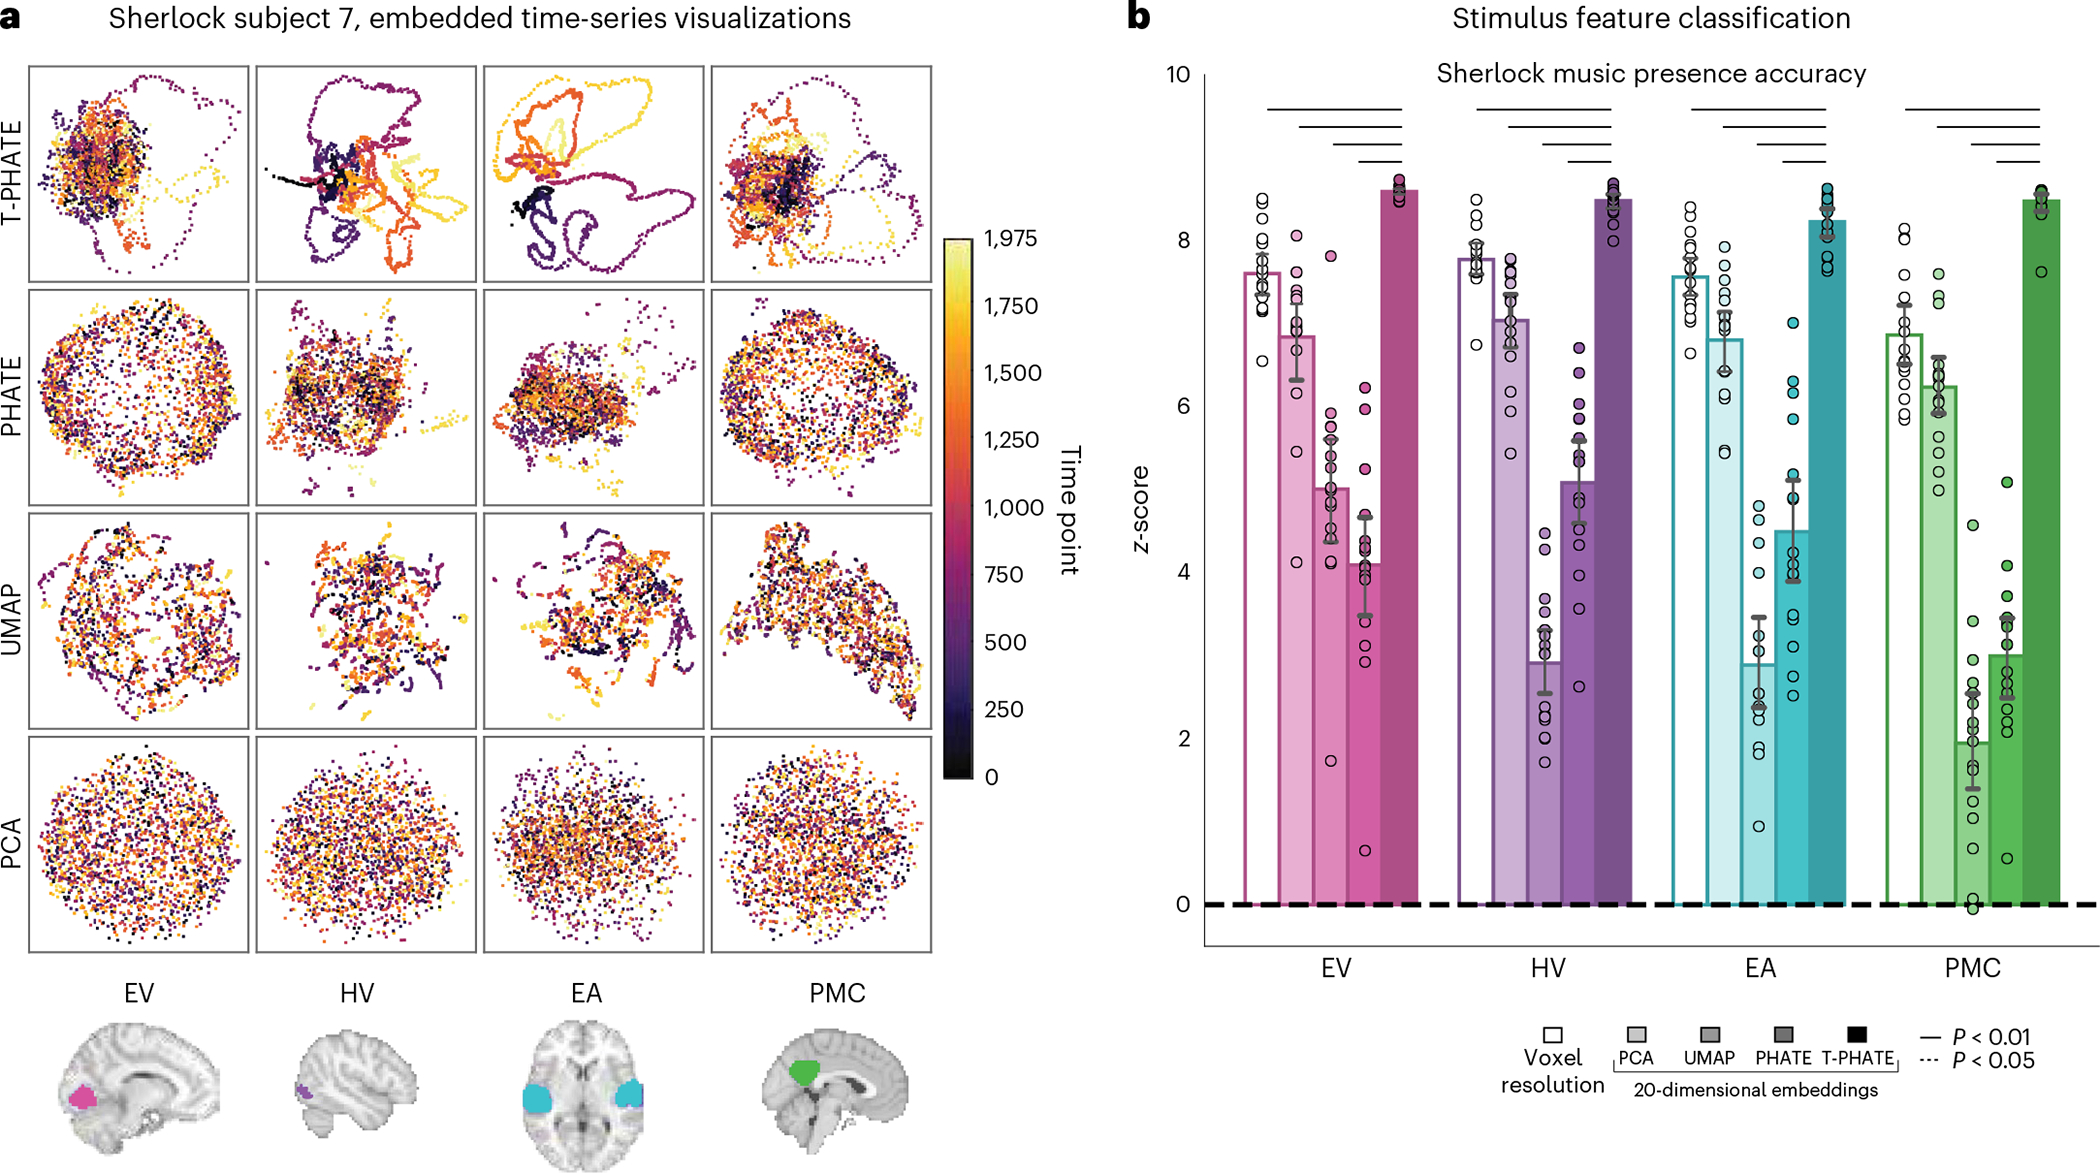
Fig. 2 |. Visual validation of T-PHATE embeddings.

a, Manifold embeddings using PCA, UMAP, PHATE, and T-PHATE for the Sherlock dataset in an example subject and four ROIs. Scatter plot points are colored by time index. b, Support vector classification accuracy predicting the presence of music in the movie at the corresponding time point. Results are presented as the z-score of the true prediction accuracy relative to a null distribution of accuracies, obtained by shifting the music labels in time relative to the embedding data 1,000 times. Dots represent individual subjects (n = 16), bars represent the average z-score across subjects, and error bars represent the 95% confidence interval of the mean, estimated with 1,000 bootstrap iterations. The significance of differences between T-PHATE and other methods is evaluated with permutation tests (10,000 iterations) and corrected for multiple comparisons. The extended results are included in Supplementary Fig. 3.
