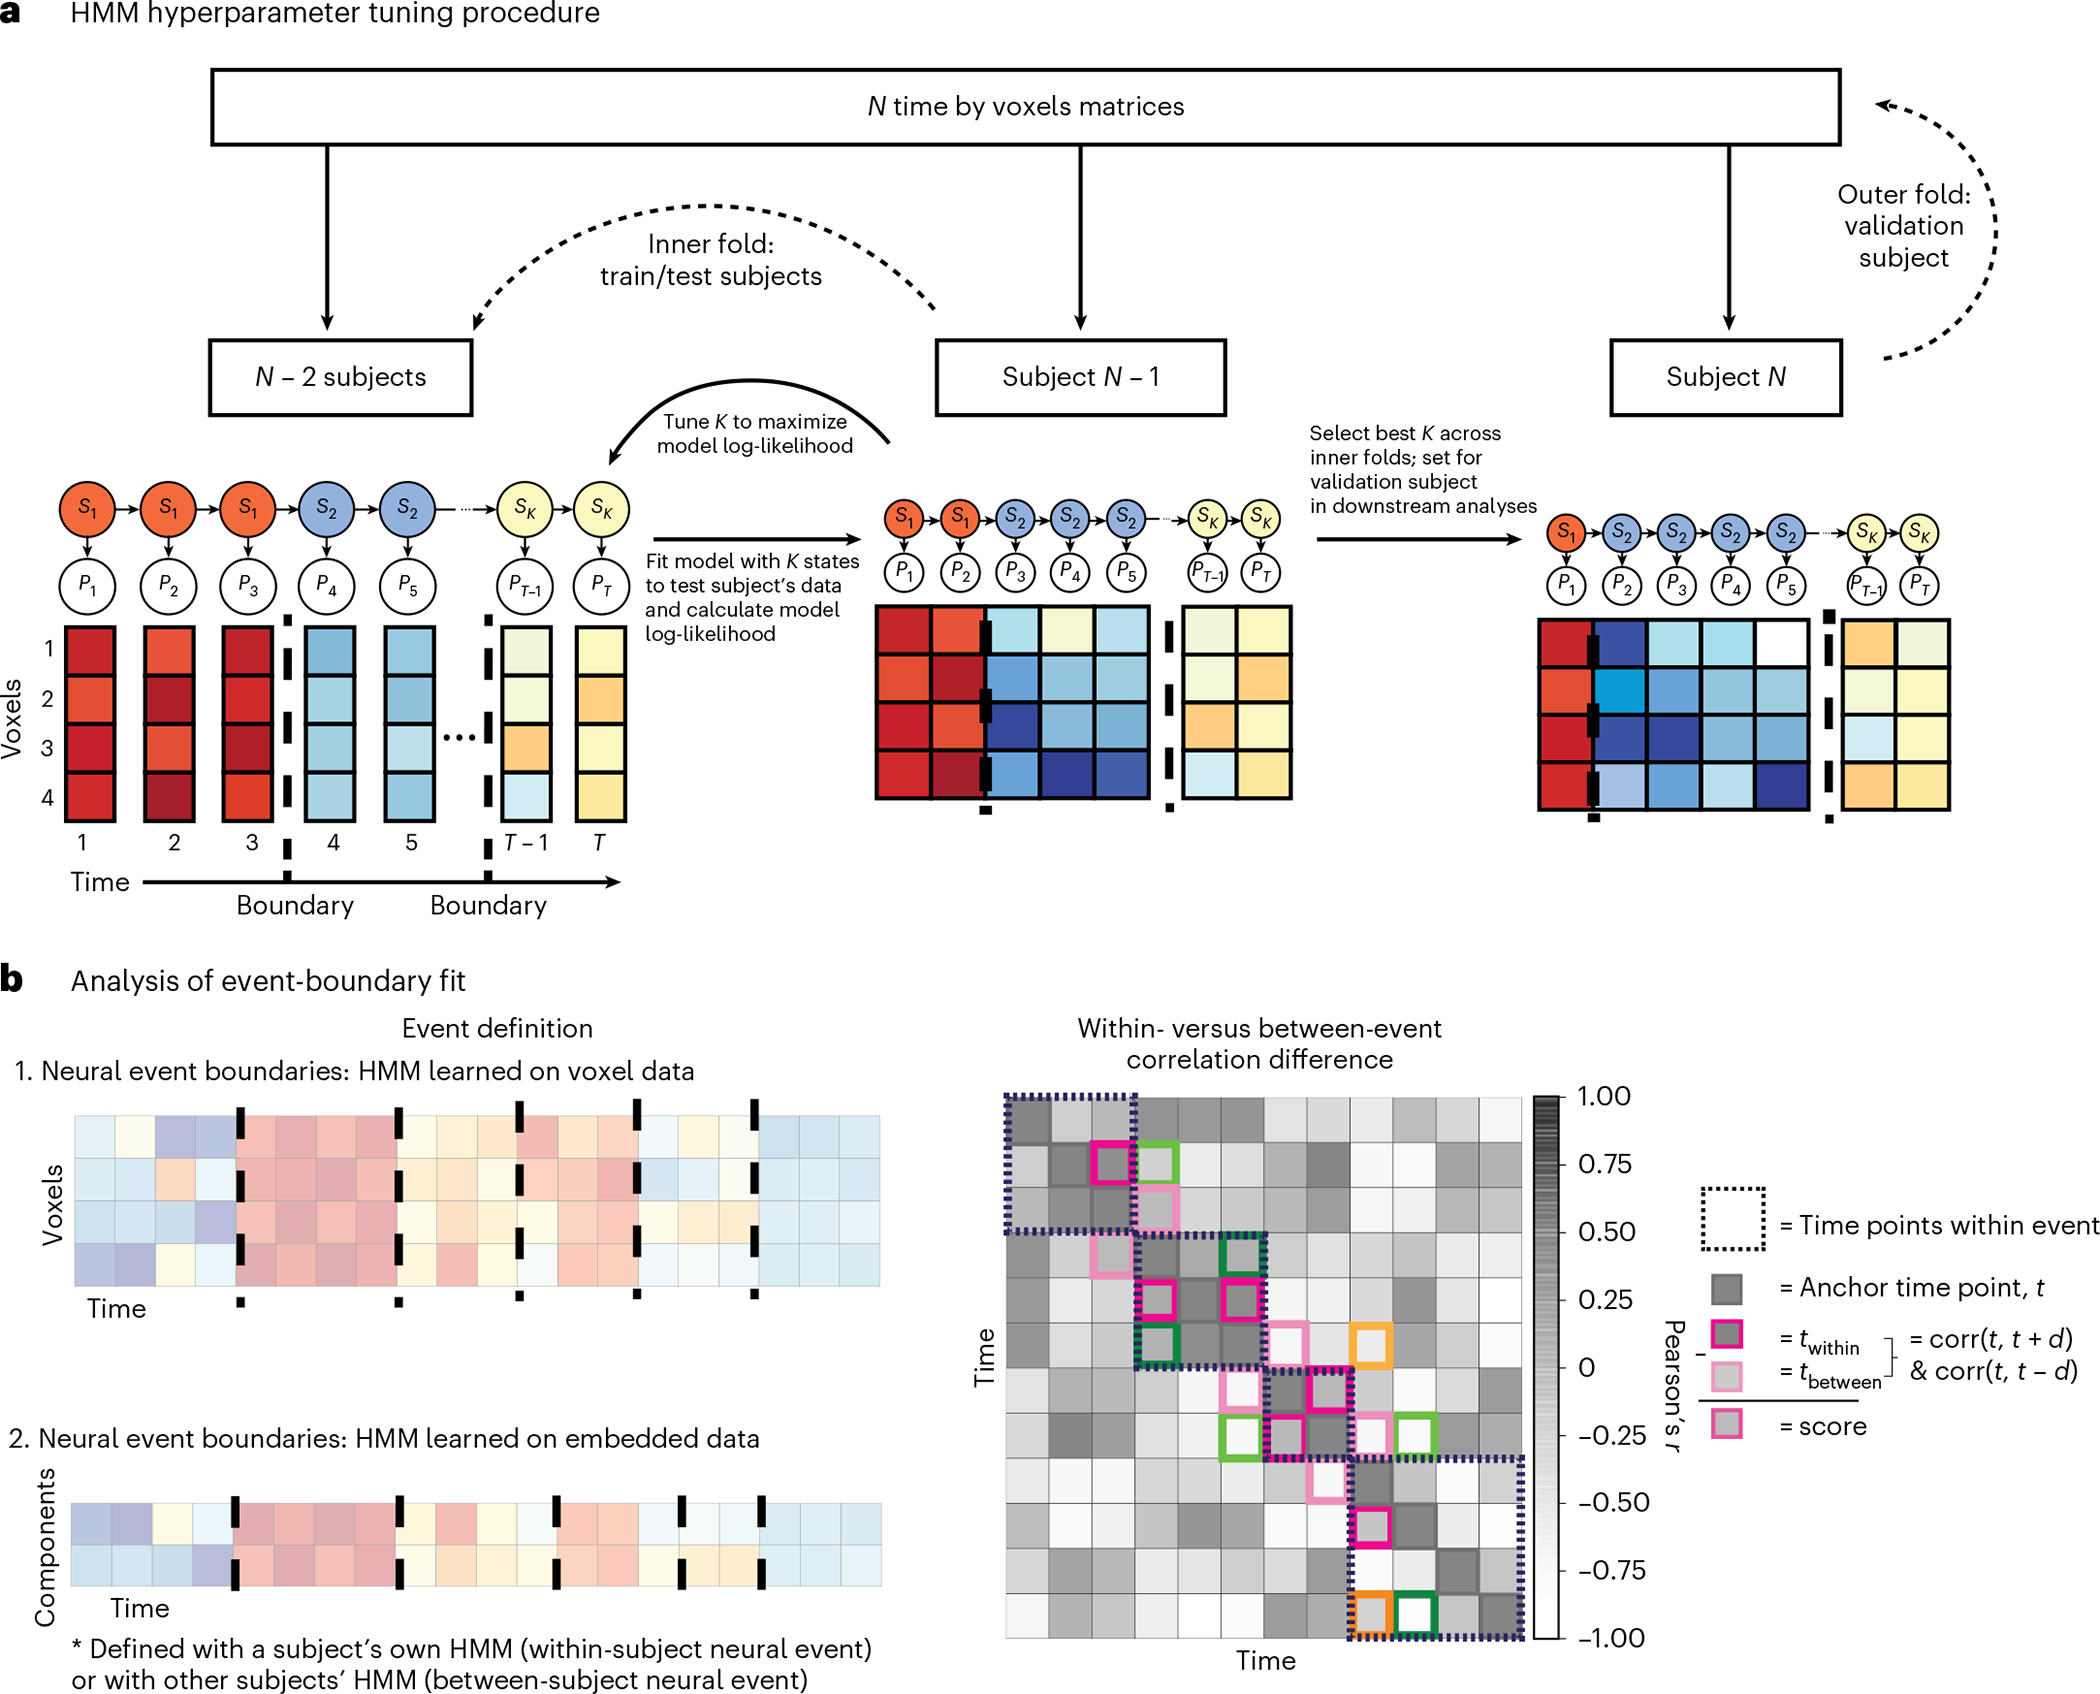
Fig. 4 |. HMM procedure and analysis.

a, Nested cross-validation procedure for hyperparameter tuning. The HMM is trained on the average data for subjects to find stable patterns of voxel activation, where the voxel patterns for each time point belong to a given hidden state is tuned according to model fit on subject (folding over all of the iterations of train/test splits) and then the best value across the folds is applied to the validation subject . This procedure is repeated for all subjects (see the ‘Optimizing the number of neural events’ section in Methods for more information). Event boundaries (dashed lines) are identified by the model as time points at a transition between hidden states. For dimensionality-reduced approaches, is learned with leave-one-subject-out cross-validation, within embedding method and ROI (see the ‘Optimizing the manifold dimensionality’ section in Methods for more information). b. Left: event boundaries are learned both from the data (by applying the HMM on voxel resolution or embedded time-series data and applying those boundaries either within or across subjects) and from independent sources such as human behavioral ratings. Right: representation of dynamic information in a latent space is quantified by applying event boundaries to embedded data. Data emphasize brain-state transitions if the boundaries maximize the difference between brain activity at time points within- versus between-events. For each time point in the time-series, we correlated the activation pattern across features at with that of and such that is in the same event as (within a dashed box) and is in a different event. The within- versus between-event correlation difference score is the subtraction of from . To account for intrinsically higher correlations of proximal time points, we restricted comparisons to where . Here, is denoted by a darker colored box and its corresponding by a lighter shade, where both and are time-steps from . Pink, green, and orange boxes indicate time points when , and 3, repsectively.
