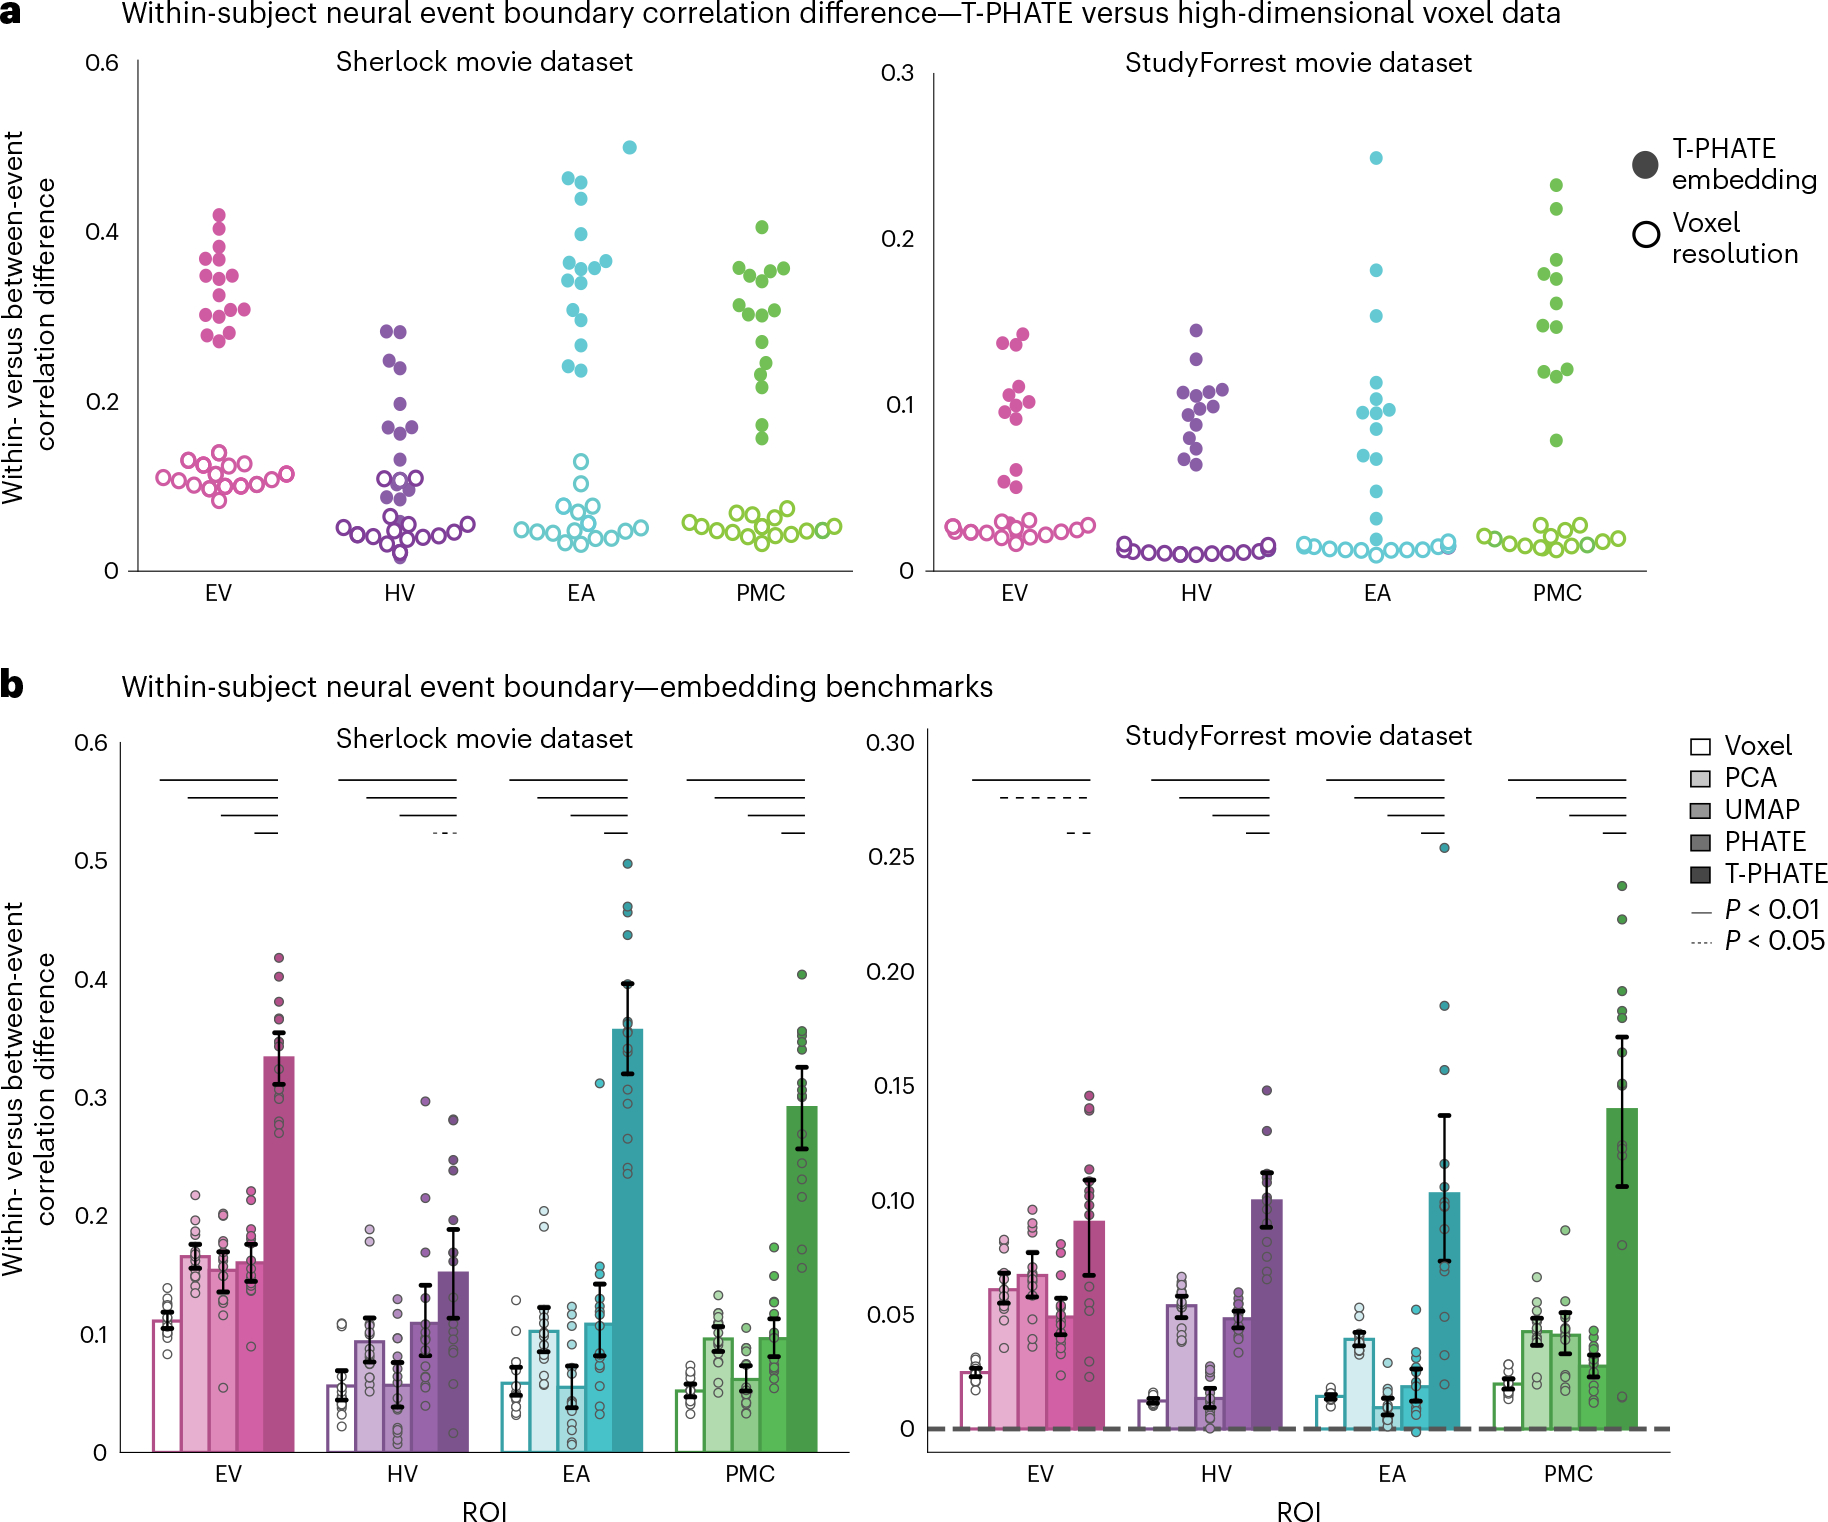
Fig. 5 |. Evaluating event segmentation within-subject.

a, After hyperparameters K and M were tuned with cross-validation, a new HMM with these parameters was fit to each subject’s data to identify neural event boundaries and calculate the within- versus between-event score, shown as one point per subject. Embedding the data with T-PHATE greatly increased the within- versus between-event score over the voxel-resolution data. b, We expanded this analysis to embeddings performed with three additional dimensionality-reduction methods. Dots represent individual subjects (n = 16 for Sherlock, n = 14 for StudyForrest); bars represent the average within- versus between-event score across subjects; error bars represent the 95% confidence interval of the mean, estimated with 1,000 bootstrap iterations. The significance of the differences between T-PHATE and other methods was evaluated with permutation tests (10,000 iterations) and corrected for multiple comparisons. See Supplementary Figs. 5a and 6a for additional benchmark results.
