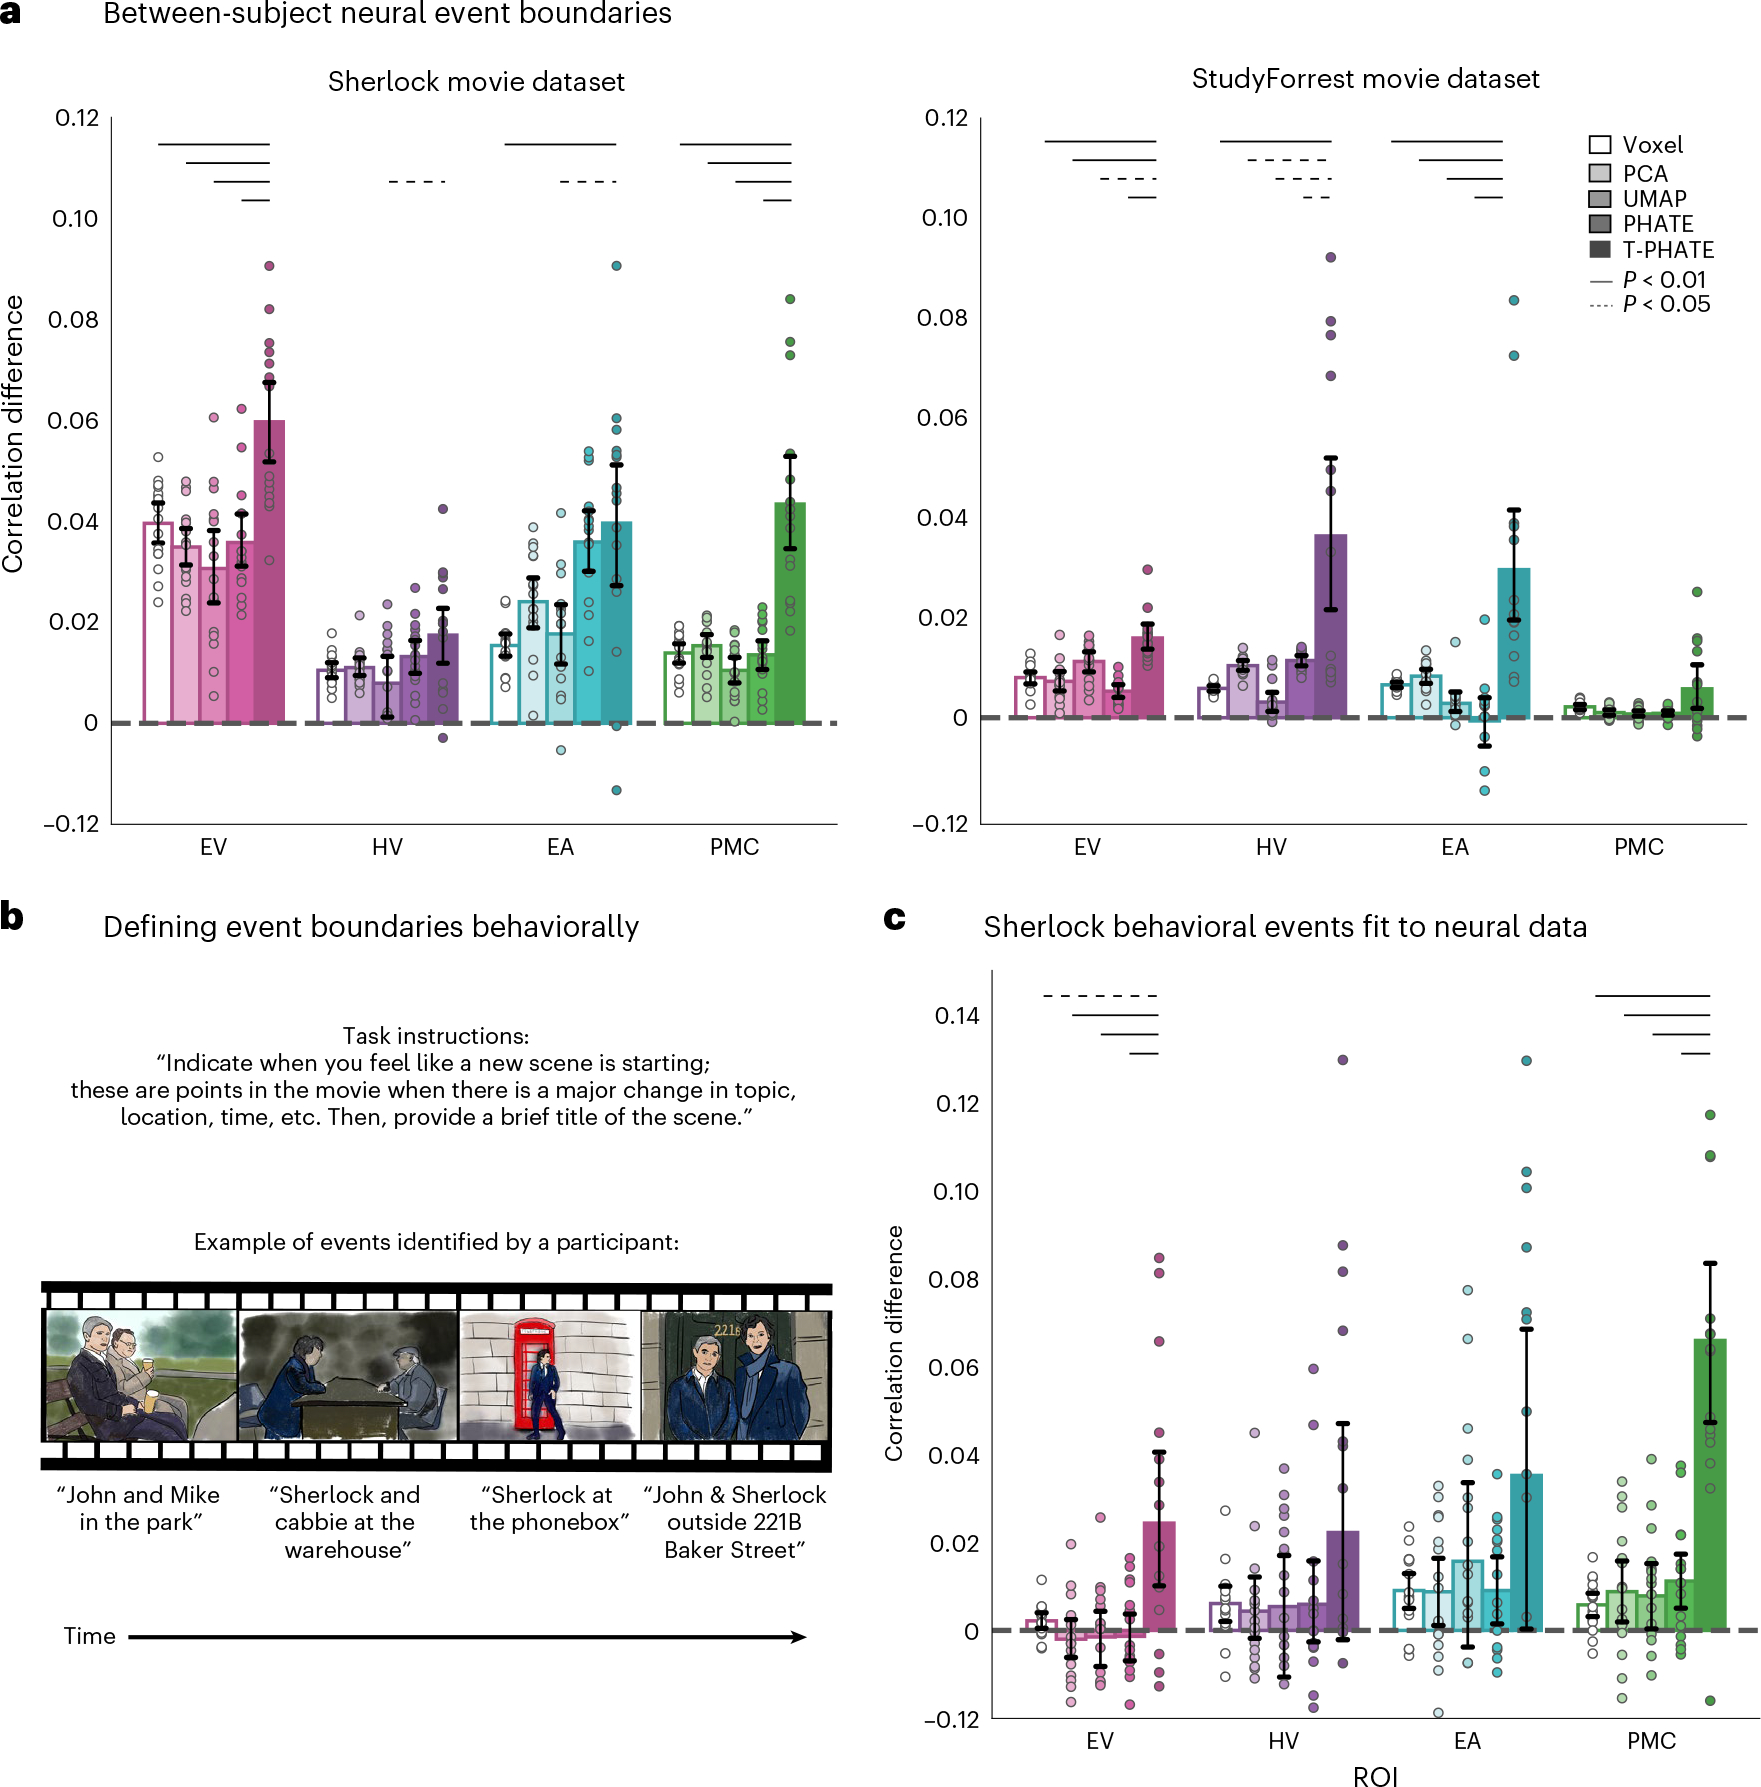
Fig. 6 |. Out-of-sample event boundary fit.

a, Event boundaries were rotated between subjects by testing subject N iteratively with the event boundaries learned from HMMs applied to each of the remaining N – 1 subjects (within ROI and embedding type). Within- versus between-event correlation difference was evaluated as in Fig. 4b. T-PHATE embeddings revealed robust event-related structure that generalized across subjects. See Supplementary Figs. 5b and 6b for additional benchmark results for this analysis. b, Event boundaries were also identified in behavioral ratings of the Sherlock movie by other subjects. These behavioral boundaries were then applied to the neural data and the within- versus between-event correlation difference was calculated as in Fig. 4b. Images in the figure are drawn for copyright reasons; movies were shown at high resolution in the experiment. c, T-PHATE revealed event structure in PMC (and to a weaker extent EV) that mirrored the behavioral boundaries. Dots represent individual subjects (n = 16 for Sherlock; n = 14 for StudyForrest); bars represent the average within- versus between-event correlation difference across subjects; error bars represent the 95% confidence interval of the mean, estimated with 1,000 bootstrap iterations. The significance of differences between T-PHATE and other methods was evaluated with permutation tests (10,000 iterations) and corrected for multiple comparisons.
