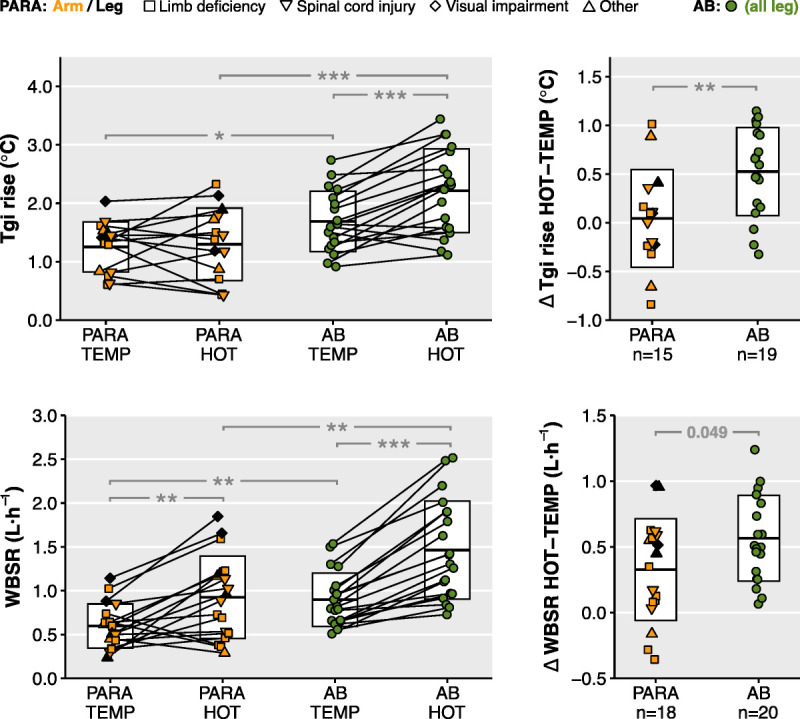
FIGURE 3.

The left panels show the exercise-induced Tgi rise and WBSR in temperate (TEMP) and hot-humid (HOT) conditions, for both para-athletes (PARA) and AB athletes. The right panels show the absolute change in Tgi rise and WBSR in hot-humid vs temperate conditions. For para-athletes, fill and shape indicate exercise mode and impairment type, respectively. Average data are presented as mean ± SD. Asterisks denote P values <0.04, with * for 0.04–0.01, ** for 0.01–0.001, and *** for <0.001, whereas exact P values are presented when P = 0.06–0.04.
