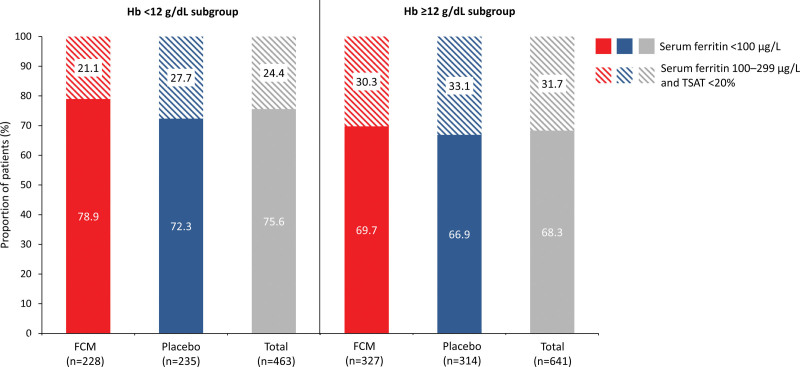
Figure 1.
Proportion of patients in each baseline hemoglobin level subgroup who had iron deficiency (defined as serum ferritin <100 µg/L or serum ferritin 100–299 μg/L with TSAT <20%). Solid colors indicate serum ferritin <100 µg/L, and diagonally striped colors indicate serum ferritin 100–299 µg/L and TSAT <20%. Data were missing for one patient on placebo in the hemoglobin level <12 g/dL subgroup and 2 patients on FCM in the hemoglobin level ≥12 g/dL subgroup. Percentages are based on the number of patients with data available. FCM indicates ferric carboxymaltose; Hb, hemoglobin; and TSAT, transferrin saturation.

