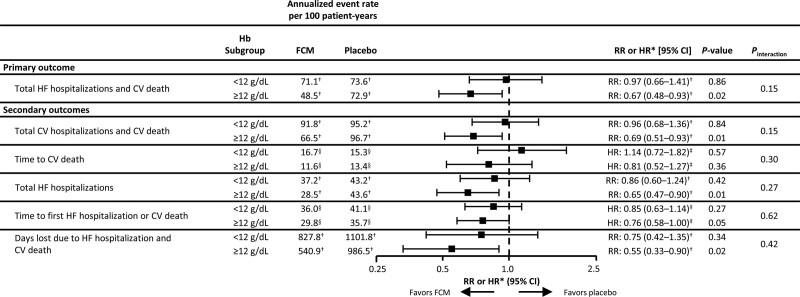
Figure 2.
Primary and secondary outcomes with FCM vs placebo at week 52, by baseline hemoglobin level. *RR or HR for FCM vs placebo in each subgroup. †Annualized event rate per 100 patient-years and RR analyzed using a negative binomial model. ‡HR for treatment difference analyzed using Cox regression model. §Percentage of patients with ≥1 event. Negative binomial model and Cox regression models both adjusted for baseline sex, age, HF etiology, HF duration, country, hemoglobin subgroup, and interaction between treatment arm and hemoglobin subgroup. Respective n-numbers for patients with hemoglobin levels <12 g/dL and ≥12 g/dL at baseline were 228 and 329 for FCM and 236 and 314 for placebo, respectively. CV indicates cardiovascular; FCM, ferric carboxymaltose; Hb, hemoglobin; HF, heart failure; HR, hazard ratio; and RR, rate ratio.

