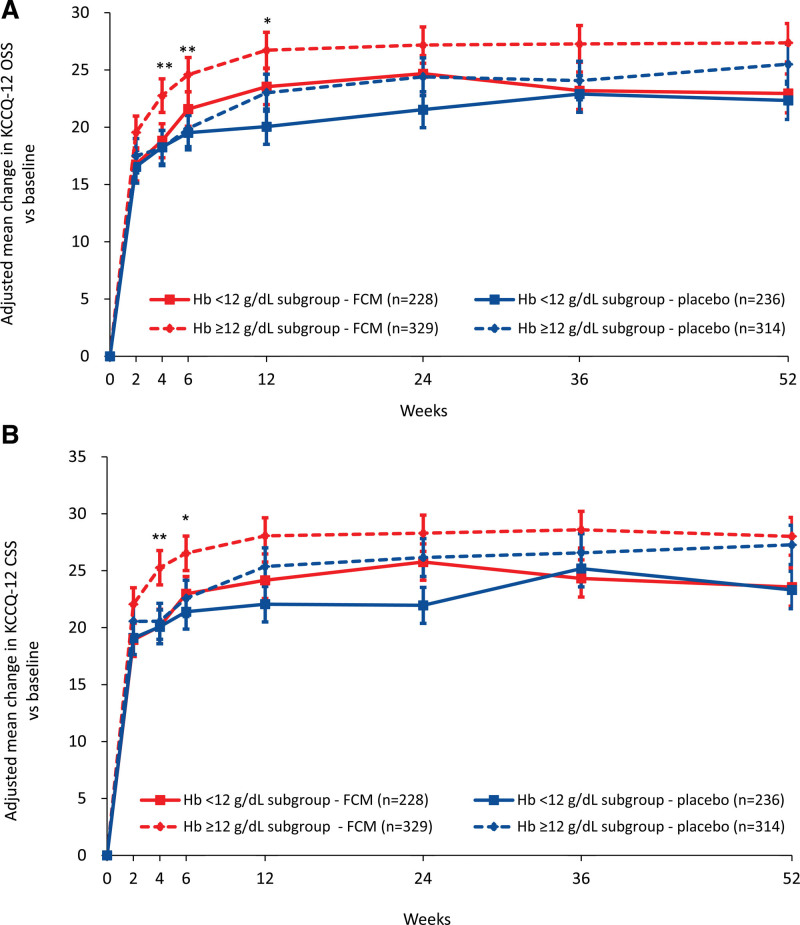
Figure 3.
Adjusted mean change in KCCQ-12 with FCM versus placebo, by baseline hemoglobin level. A, KCCQ-12 OSS; B, KCCQ-12 CSS. *P<0.05, **P<0.01 for FCM vs placebo in the low hemoglobin level ≥12 g/dL subgroup only. Error bars are standard error of the mean. Estimates are based on a mixed-effect model of repeated measures using an unstructured covariance matrix: change score = baseline score + treatment + visit + treatment × visit + subgroup + subgroup × visit + subgroup × treatment + subgroup × treatment × visit + baseline covariates. CSS indicates clinical summary score; FCM, ferric carboxymaltose; Hb, hemoglobin; KCCQ-12, 12-item Kansas City Cardiomyopathy Questionnaire; and OSS, overall summary score.

