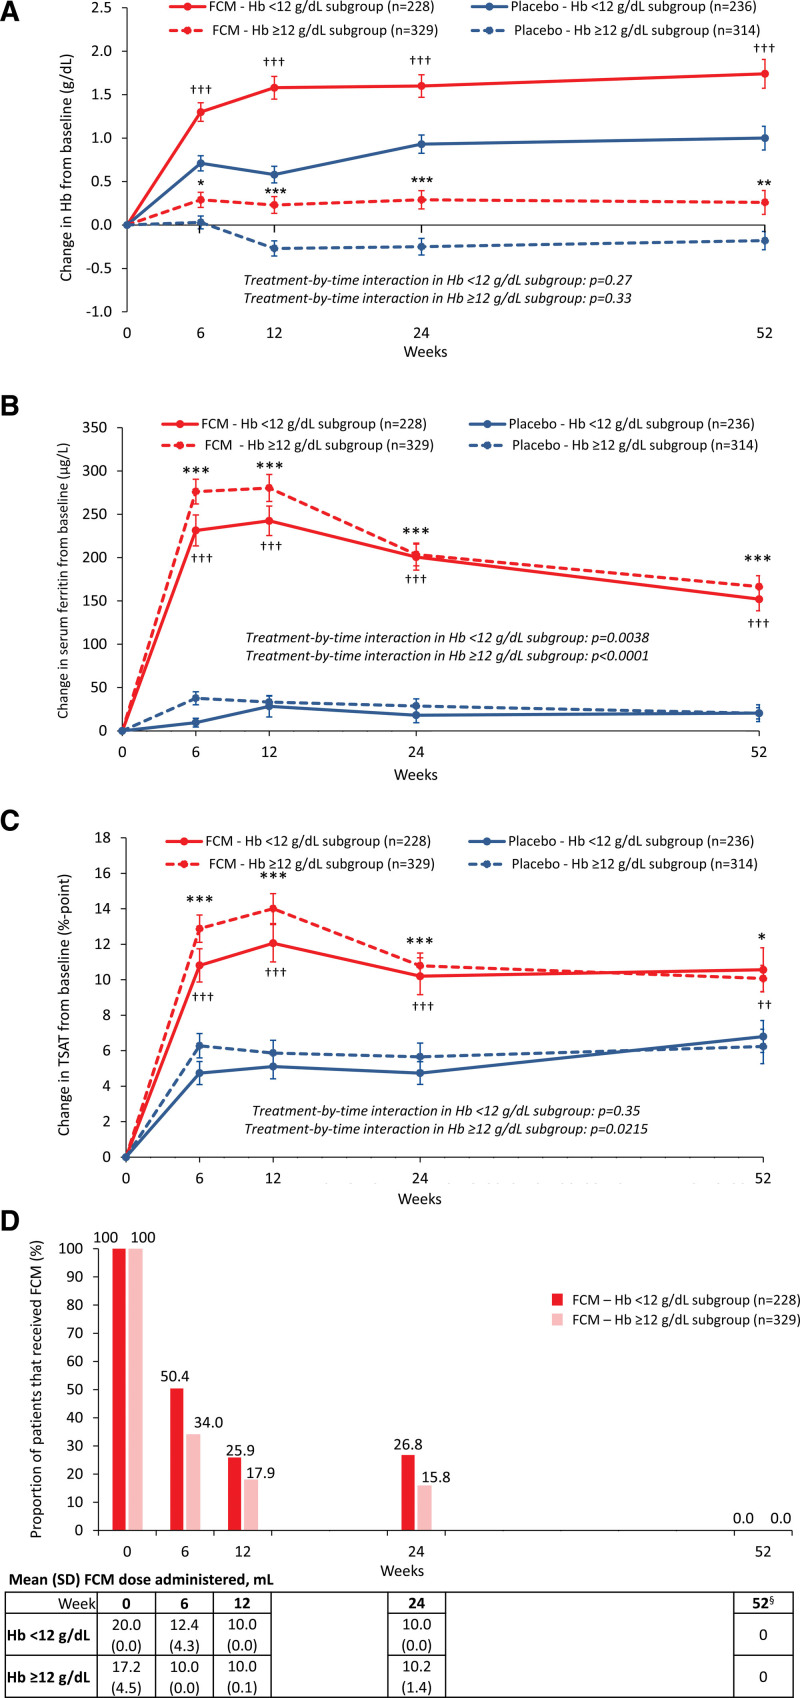
Figure 4.
Change vs baseline in hemoglobin, serum ferritin, and TSAT over time with FCM and placebo, and details of FCM administration at each time point by baseline hemoglobin level. A, Hemoglobin level; B, serum ferritin concentration; C, TSAT; and D, proportion of patients having received FCM at each time point. *P<0.05, **P<0.01 and ***P<0.001 for FCM vs placebo in the hemoglobin level ≥12 g/dL subgroup and †P<0.05, ††P<0.01 and †††P<0.001 for FCM vs placebo in the hemoglobin level <12 g/dL subgroup. §No study drug was administered after week 24, as per protocol. Error bars are standard error of the mean. FCM indicates ferric carboxymaltose; Hb, hemoglobin; and TSAT, transferrin saturation.

