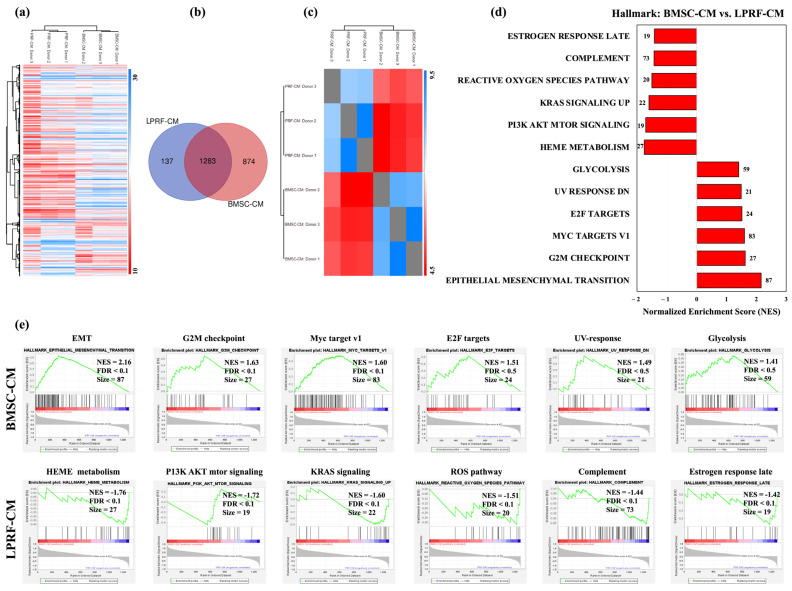
Figure 2.
Gene set enrichment analysis (GSEA) of BMSC-CM and LPRF-CM. (a) Hierarchical clustering analysis of the shared proteins for each CM group in the comparison of LPRF-CM donors (right column) and BMSC-CM donors (left column); expression values are represented as colors and range from blue (high expression), white (moderate), to red (low expression). (b) Venn diagram illustrating the number of differentially expressed proteins (DEPs) in each CM group. (c) Protein intensity correlation analysis based on all samples showing detectable intensity levels for all three donors in each CM group: Pearson R ≥ 0.4 suggesting weak correlation between the BMSC-CM and LPRF-CM populations. (d) Results of GSE/hallmark analysis showing significantly enriched gene sets in each group (FDR < 25%); a positive normalized enrichment score (NES) indicates enrichment in the BMSC-CM group, while a negative NES indicates enrichment in the LPRF-CM group. (e) Enrichment plots for all significant datasets enriched in GSE/hallmark analysis at FDR < 25% showing the profile of the NES, FDR ratio, and number of proteins.

