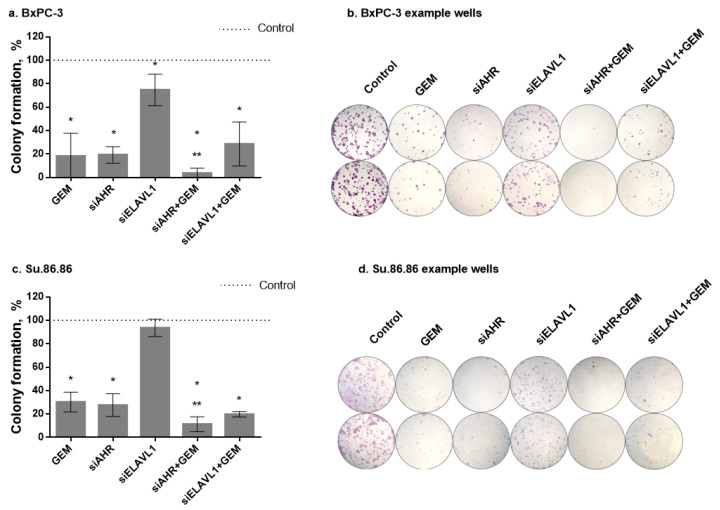
Figure 9.
PDAC cell colony formation. Colony formation after silencing AHR or ELAVL1 genes by transfection and/or exposure to GEM. Cells for clonogenic assay were seeded after 24 h transfection and grown for 168 h after seeding: (a) BxPC-3 colony formation graph, (b) BxPC-3 colony formation example photos, (c) Su.86.86 colony formation graph, and (d) Su.86.86 colony formation example photos. N ≥ 4, MEAN ± SD * p < 0.05 when compared with respective control. ** p < 0.05 when compared with GEM alone.

