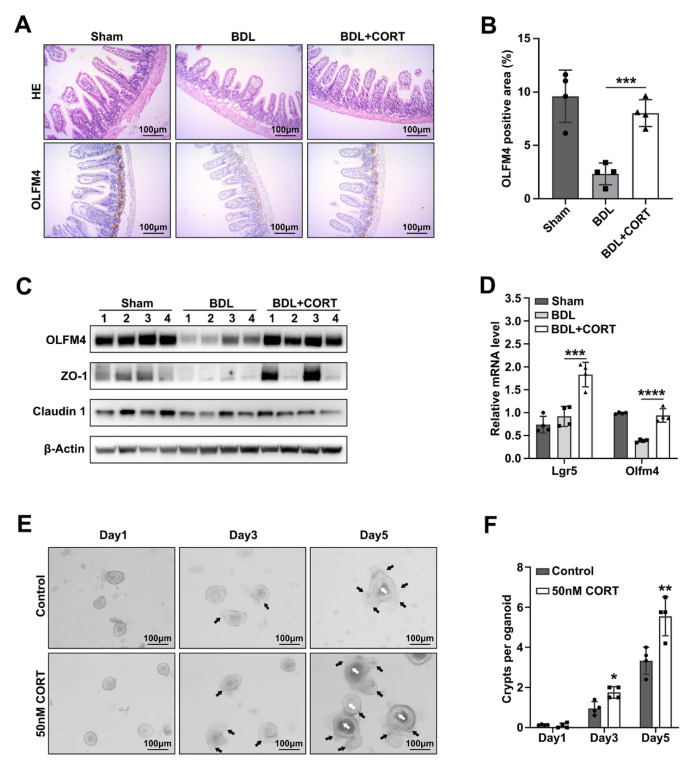
Figure 4.
CORT protects the intestinal barrier and stemness after BDL. (A) HE staining and OLFM4 IHC staining of intestine in Sham, BDL, and BDL+CORT mice group, with a 100× magnification. (B) Quantification of the OLFM4-positive area, n = 4 per group. Data are shown as the mean ± SD per group, and statistical analysis was performed via one-way ANOVA: *** p < 0.005. (C) The protein expression of OLFM4, ZO-1, and Claudin 1 in sham, BDL, and BDL+CORT mice intestines. (D) Relative mRNA levels of Lgr5 and Olfm4 in sham, BDL, and BDL+CORT mice intestines. Actb was used as a reference gene, n = 4 per group. Data are shown as the mean ± SD per group, and statistical analysis was performed via one-way ANOVA: *** p < 0.005 and **** p < 0.001. (E) The intestine organoids were cultured with 50 nM CORT or DMSO as a control, and the development of organoids on day 1, day 3, and day 5 was recorded at 100× magnification. The white arrow indicates the lumen of the organoid, and the black arrow indicates the newborn crypts. (F) Quantification of the number of crypts per organoid in these three groups on days 1, 3, and 5. Data are shown as the mean ± SD per group, and statistical analysis was performed via two-way ANOVA: * p < 0.05 and ** p < 0.01.

