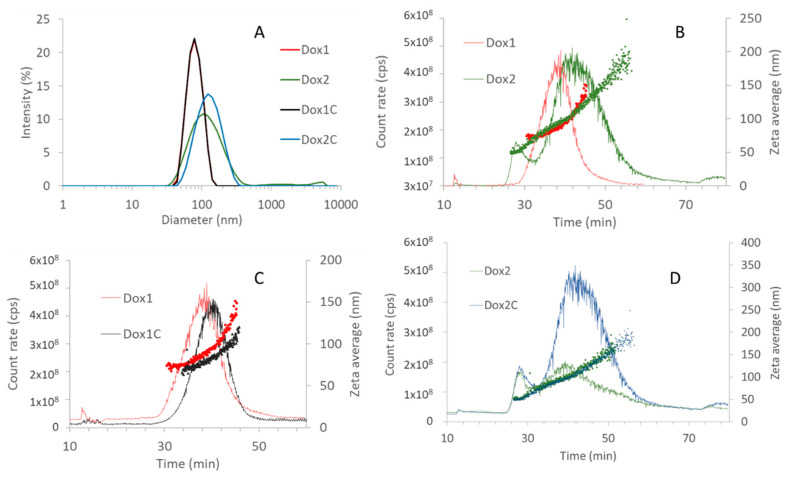
Figure 2.
(A) Batch-mode DLS data reported as intensity-based differential size distribution. Averages of three measurements are shown. AF4-DLS analysis results of (B) Dox1 and Dox2 loaded liposomes and (C) Dox1 and its corresponding carrier formulation, (D) Dox2 and its corresponding carrier formulation in PBS. The scattered intensity and size vs. elution time from flow mode-DLS data are shown for a representative measurement for each selected sample for Dox1 in red, Dox1C in black, Dox2 in green, Dox2C in blue. Hydrodynamic diameters are represented with dots, scattering intensity peaks with lines. Details of experimental conditions are reported in Section 4.2.

