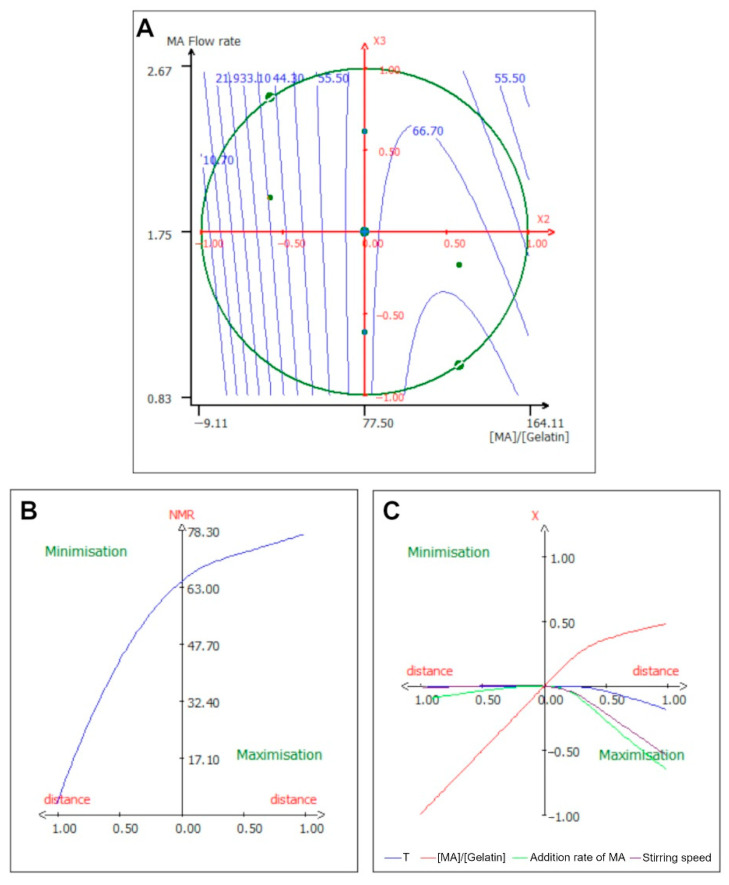
Figure 2.
Isocurve of interaction parameters and optimization pathway for the lysine substitution rate. (A) Surface plot showing the effects of the mutual interaction between the [MA]/[Gelatin] ratio (X2) and MA flow rate (X3) on the lysine substitution rate, while the other variables are kept at their center point. (B) Optimization path of the response in order to maximize or minimize the lysine substitution rate; each independent variable has the same variation in centered reduced value. (C) Optimization path of the response (X-axis) for each separate parameter (Y-axis) expressed in reduced value and centered reduced value, respectively.

