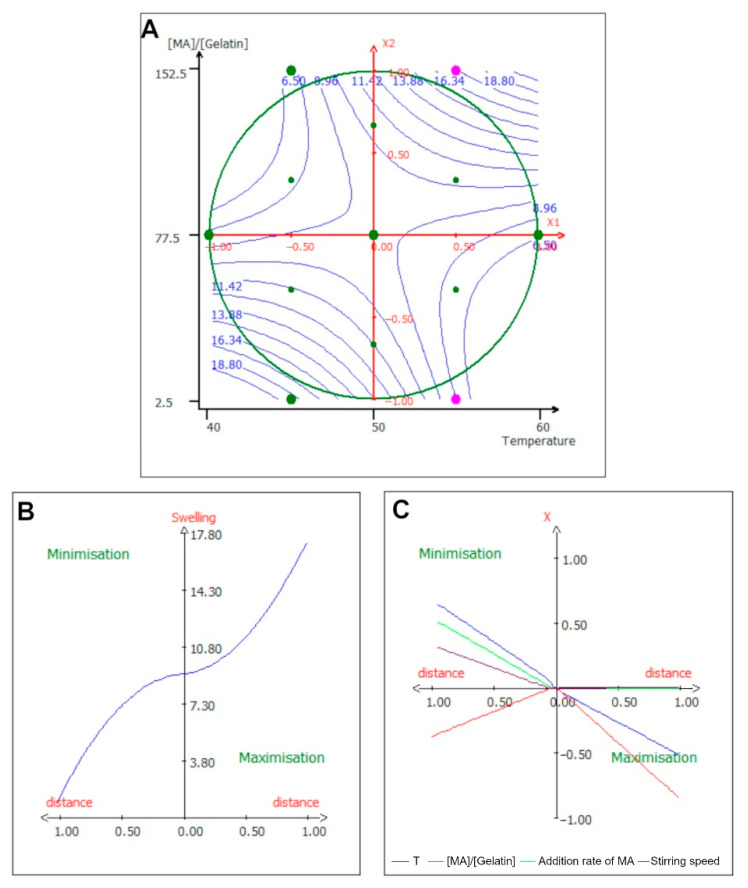
Figure 3.
Isocurve of interaction parameters and optimization pathway for the swelling ratio. (A) Surface plot showing the effects of the mutual interaction between the temperature and the [MA]/[Gelatin] ratio on the swelling ratio, while the other variables are kept at their center point. (B) Optimization path of the response in order to maximize or minimize the swelling ratio; each independent variable has the same variation in centered reduced value. (C) Optimization path of the response (X-axis) for each separate parameter (Y-axis) expressed in centered reduced value.

