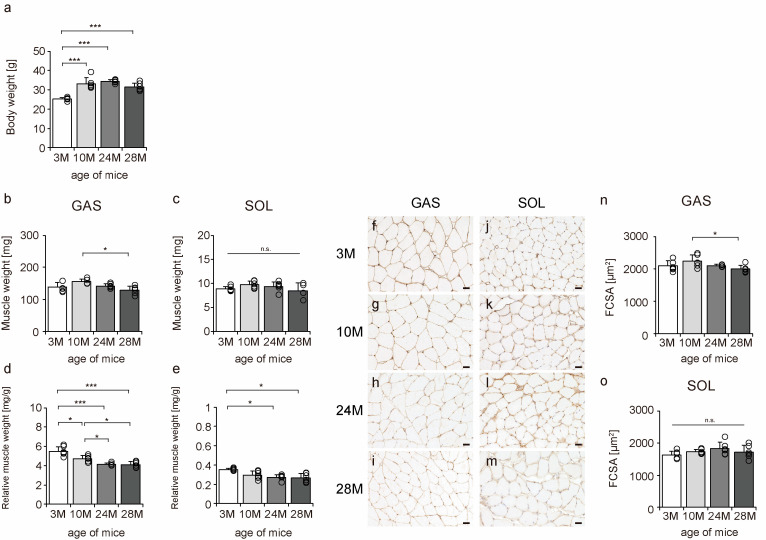
Figure 1.
Changes in body weight, muscle weight, relative muscle weight, and fiber cross-sectional area. Body weight (a), muscle weight (b,c), relative muscle weight (d,e), cross-sections stained with an anti-collagen IV antibody (f–m), and fiber cross-sectional area (FCSA) (n,o). Staining of the gastrocnemius (f–i) and soleus (j–m) muscles observed in 3 M (f,j), 10 M (g,k), 24 M (h,l), and 28 M (i,m) for FCSA measurements (scale bar = 25 µm). Data are presented as the mean ± standard deviation (n = 6 per group). GAS, gastrocnemius muscle; SOL, soleus muscle; 3 M, 3-month-old; 10 M, 10-month-old; 24 M, 24-month-old; 28 M, 28-month-old. *** p < 0.0001, * p < 0.05. n.s.: not significant. All data are represented as dots in the graph.

