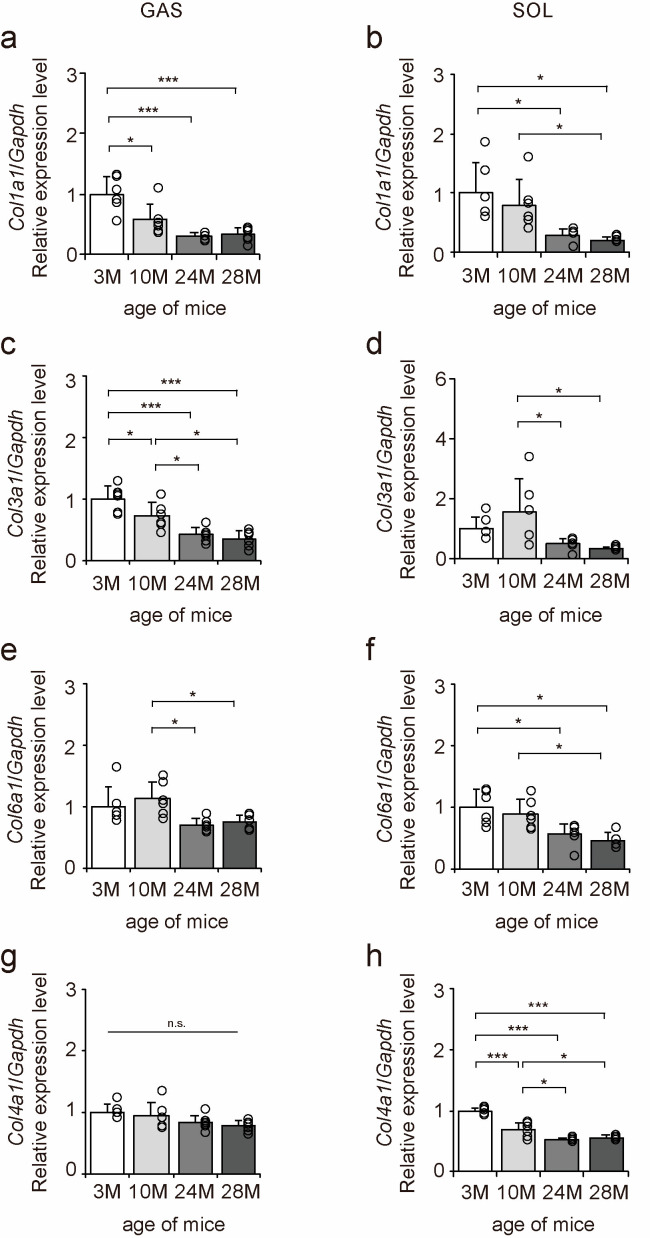
Figure 2.
Changes in the expression of collagen genes in skeletal muscle. Changes in relative mRNA expression levels of Col1a1 (a,b), Col3a1 (c,d), Col6a1 (e,f), and Col4a1 (g,h) in the gastrocnemius (GAS) and soleus (SOL) muscles. Data are presented as the mean ± standard deviation, n = 6 per group. 3 M, 3-month-old; 10 M, 10-month-old; 24 M, 24-month-old; 28 M, 28-month-old. *** p < 0.0001, * p < 0.05. n.s.: not significant. All data are represented as dots in the graph.

