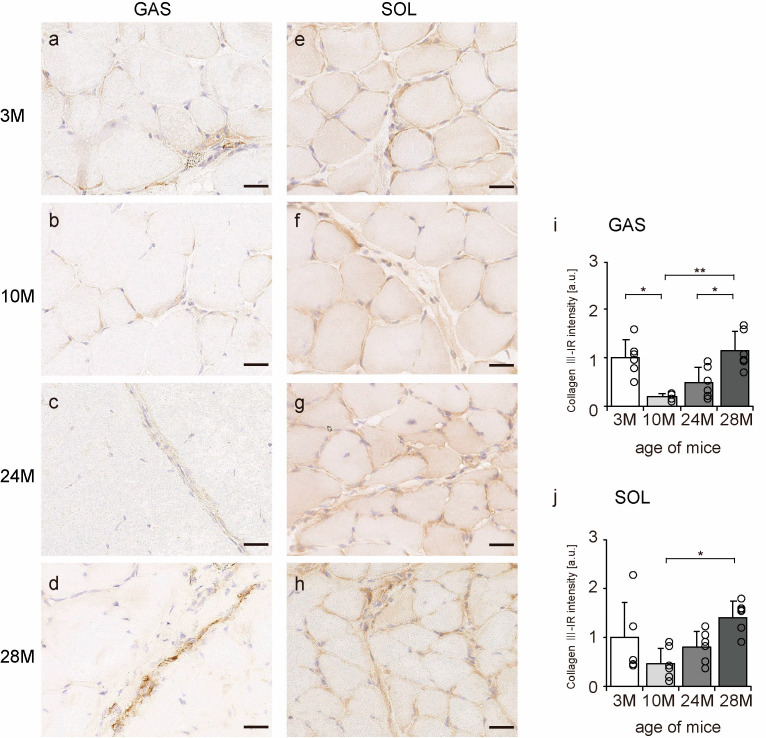
Figure 4.
Collagen III localization. Cross-sections of the gastrocnemius (a–d) and soleus (e–h) muscles were stained with anti-collagen III antibody. Staining images of the 3 M (a,e), 10 M (b,f), 24 M (c,g), and 28 M (d,h) groups are shown (scale bar = 25 µm). Collagen III-immunoreactivity (IR) intensity in gastrocnemius (i) and soleus muscles (j) was measured. Data are presented as the mean ± standard deviation, n = 6 per group. 3 M, 3-month-old; 10 M, 10-month-old; 24 M, 24-month-old; 28 M, 28-month-old; GAS, gastrocnemius muscle; SOL, soleus muscle. ** p < 0.001, * p < 0.05. All data are represented as dots in the graph.

