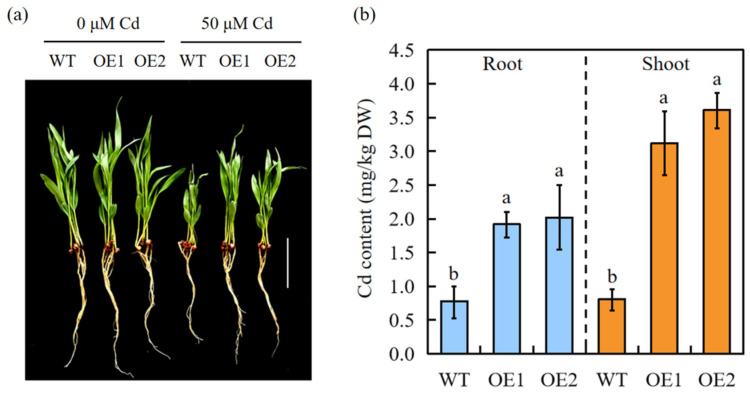
Figure 3.
SbEXPA11 transgenic sorghum plants. (a) Phenotype of WT and SbEXPA11 transgenic plants under hydroponic conditions. Bar = 1 cm. (b) Cd content in shoots and roots of WT and SbEXPA11 transgenic plants under hydroponic conditions. Error bars are ±SE of n = 3. Significant differences analysis was carried out by one-way ANOVA and Tukey’s post hoc test. Different letters above the column indicate significant differences (p < 0.05).

