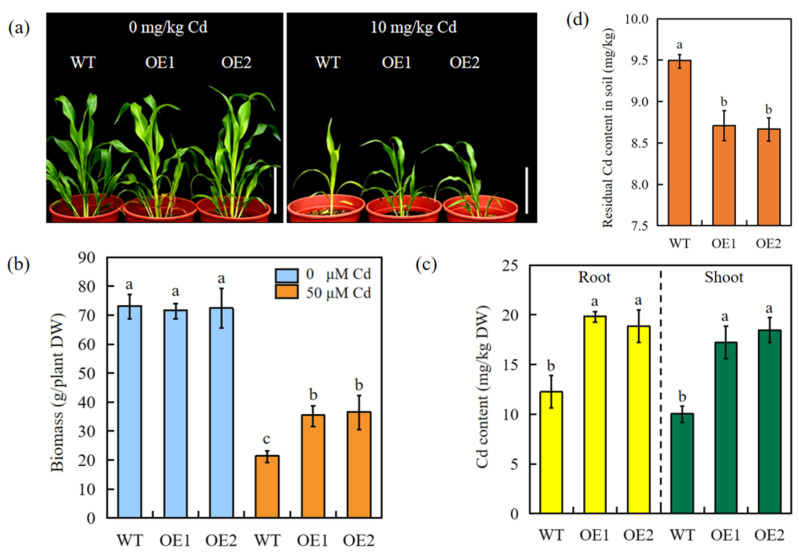
Figure 6.
The phenotype of SbEXPA11 transgenic sorghum plants. (a) Photograph showing phenotype of WT and SbEXPA11-overexpression sorghum seedlings under normal and Cd stress conditions. Scale bar = 10 cm. (b) Biomass of WT and SbEXPA11-overexpression sorghum with or without Cd treatment under pot experiment. (c) Cd content in shoots and roots of WT and SbEXPA11 transgenic plants under pot experiment. (d) Residual Cd content in the soil after growing of WT and SbEXPA11 transgenic plants. Error bars are ±SE of n = 3. Significant differences analysis was carried out by one-way ANOVA and Tukey’s post hoc test. Different letters above the column indicate significant differences (p < 0.05).

