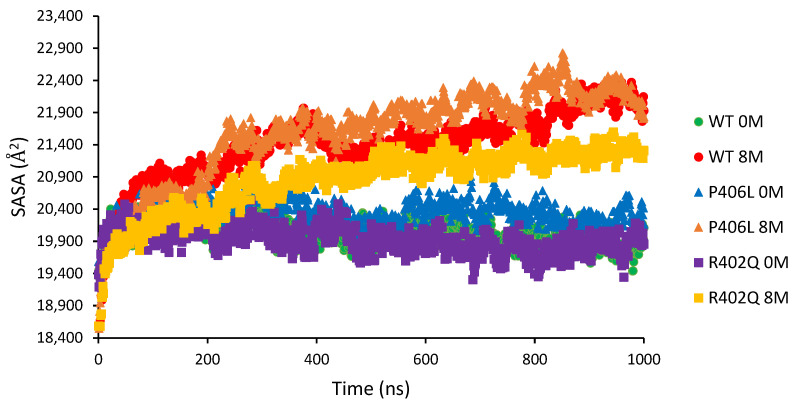
Figure 4.
Comparing MD trajectories between wild type and mutants for water and 8M urea environments. Displayed here are the average SASA values for the WT (circles), P406L mutant (triangles), and R402Q mutant (squares) in water and 0M urea at 1 μs. Each condition was run in triplicate from which the averages were found.

