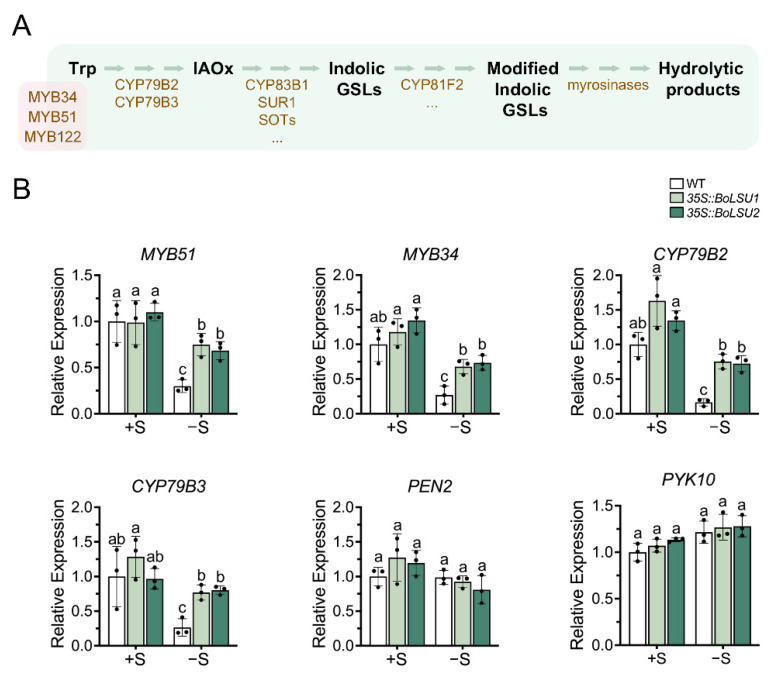
Figure 6.
Expression of key genes in indolic glucosinolate metabolic pathway under normal sulfur (+S) and sulfur deficiency (−S) conditions. (A) Schematic diagram of indolic glucosinolate metabolic pathway. Trp, tryptophan; IAOx, Indole-3-acetaldoxime; GSLs, glucosinolates. Metabolites are depicted in black. Transcription factors (MYB34, MYB51 and MYB122) and enzymes are depicted in brown. (B) Relative expression level of genes of indolic glucosinolate metabolic pathway in WT, 35S::BoLSU1 and 35S::BoLSU2. Scatter plots indicate three biological replicates. Different letters indicate significant differences (Tukey’s post hoc test, p < 0.05).

