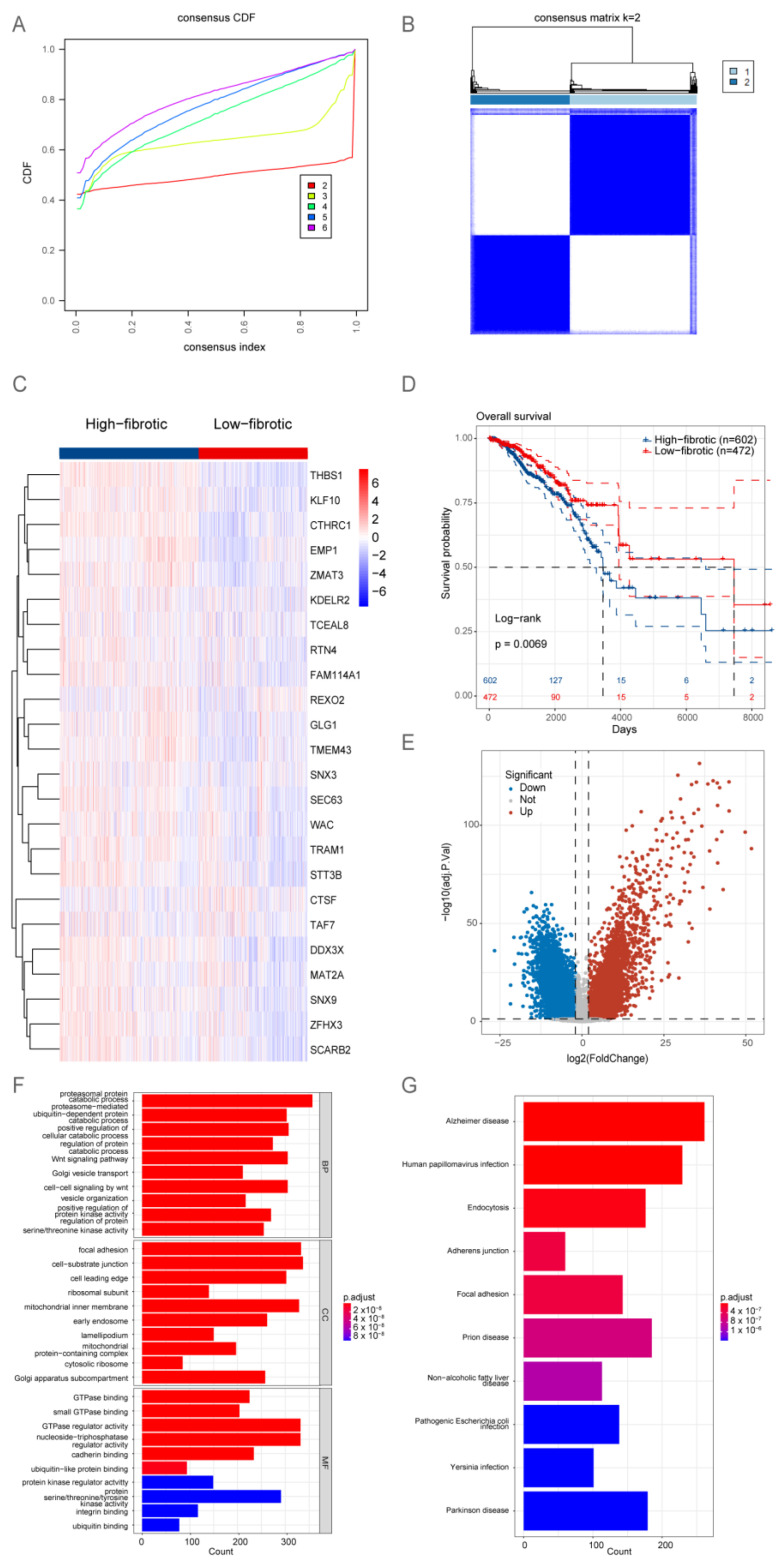
Figure 2.
Bulk RNA sequencing (RNA-seq) analysis suggests that the accumulation of matrix cancer-associated fibroblasts (mCAFs) is a key factor determining the poor prognosis of patients. (A) The cumulative distribution function (CDF) plot shows the consistency matrix for each value of k (ranging from 2 to 6). Different colors indicate different clusters. A sharp turning point in the curve was observed when k = 2, indicating the optimal clustering performance. (B) Consistency matrix of the k = 2 consensus clustering for the characteristic genes of 24 mCAFs aligned with The Cancer Genome Atlas-breast cancer (TCGA-BRCA) dataset. (C) Heatmap showing the gene expression profile of 24 mCAFs. The high and low expression groups were defined as the high-fibrotic and low-fibrotic groups, respectively. (D) Kaplan–Meier analysis of the overall survival (OS) of two groups of patients with BRCA. The prognosis of the high-fibrotic group was poor when compared with that of the low-fibrotic group. (E) The volcano plot illustrates the results of differential analysis performed with two groups of samples in (C) using the Limma software package. (F) The bar plot shows the results of Gene Ontology (GO) enrichment analysis of differentially expressed genes in (E), including molecular function (MF), biological process (BP), and cellular component (CC). The color of the bars represents the adjusted p-value, while the length represents the number of enriched genes. (G) The bar plot shows the results of Kyoto Encyclopedia of Genes and Genomes (KEGG) pathway analysis of differentially expressed genes in (E). The color of the bars represents the adjusted p-value, while the length represents the number of genes enriched in the pathway.

