Figure 4.
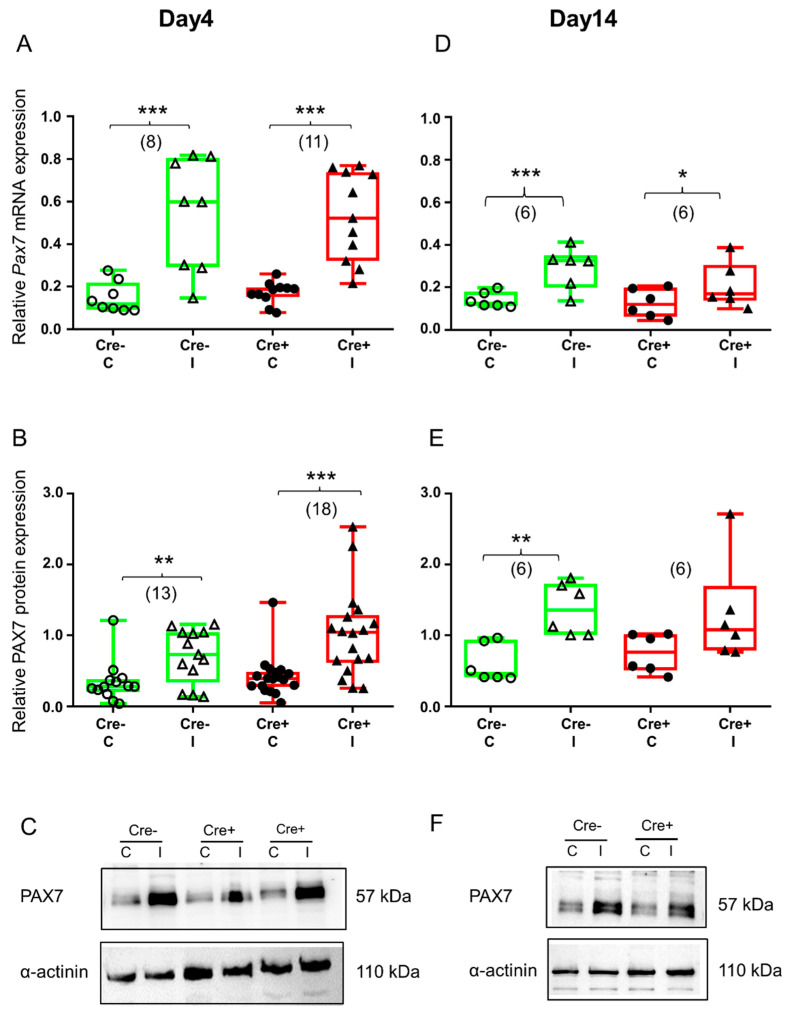
Skeletal muscle injury is reflected in the upregulation of satellite cell marker PAX7. Green color represents Cre− data and red color refers to Cre+ data. Numbers in brackets indicate the number of muscle samples. (A) Relative Pax7 mRNA expression (normalized to AP3D1 as the internal control) in m. tibialis anterior from young Cre− and Cre+ mice 4 days after BaCl2 injection for control (C) and injected (I) legs. (B) Relative PAX7 protein expression (normalized to α-actinin as the internal control) in m. tibialis anterior from young Cre− and Cre+ mice 4 days after injection. (C) Representative images of Western blot showing expression changes in PAX7 protein on day 4. (D) Relative Pax7 mRNA expression in m. tibialis anterior from young Cre− and Cre+ mice 14 days after injection. I Relative PAX7 protein expression in m. tibialis anterior from young Cre− and Cre+ mice 14 days after injection. (F) Representative images of Western blot showing expression changes in PAX7 protein on day 14. Asterisks indicate statistically significant difference (* p < 0.05, ** p < 0.005, *** p < 0.001 Student’s t-test). Actual p values when p > 0.001 are: (B); Cre− C vs. Cre− I p = 0.002; (D) Cre+ C vs. Cre+ I p = 0.010; (E) Cre− C vs. Cre− I p = 0.002, Cre+ C vs. Cre+ I p = 0.086.

