Figure 5.
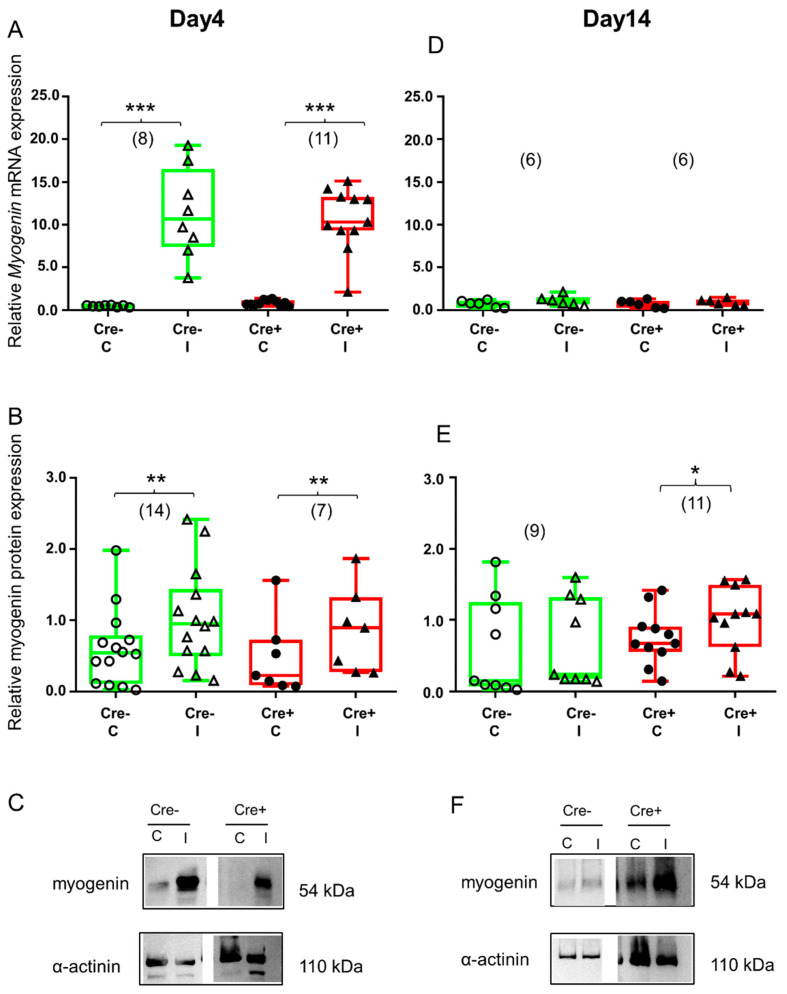
Regeneration marker myogenin is increased during the early stage of regeneration. Green color represents Cre− data and red color refers to Cre+ data. Numbers in brackets indicate the number of muscle samples. (A) Relative myogenin mRNA expression (normalized to AP3D1 as the internal control) in m. tibialis anterior from young Cre− and Cre+ mice 4 days after BaCl2 injection for control (C) and injected (I) legs. (B) Relative myogenin protein expression (normalized to α-actinin as the internal control) in m. tibialis anterior from young Cre− and Cre+ mice 4 days after injection. (C) Representative images of Western blot images showing expression changes in myogenin protein on day 4. (D) Relative myogenin mRNA expression in m. tibialis anterior from young Cre− and Cre+ mice 14 days after injection. (E) Relative myogenin protein expression in m. tibialis anterior from young Cre− and Cre+ mice 14 days after injection. (F) Representative images of Western blot showing expression changes in myogenin protein on day 14. Asterisks indicate statistically significant difference (* p < 0.05, ** p < 0.005, *** p < 0.001 Student’s t-test). Actual p values when p > 0.001 are: (B) Cre− C vs. Cre− I p = 0.002; Cre+ C vs. Cre+ I p = 0.002; (D) Cre− C vs. Cre− I p = 0.135; Cre+ C vs. Cre+ I p = 0.308; (E) Cre− C vs. Cre− I p = 0.445; Cre+ C vs. Cre+ I p = 0.022.

