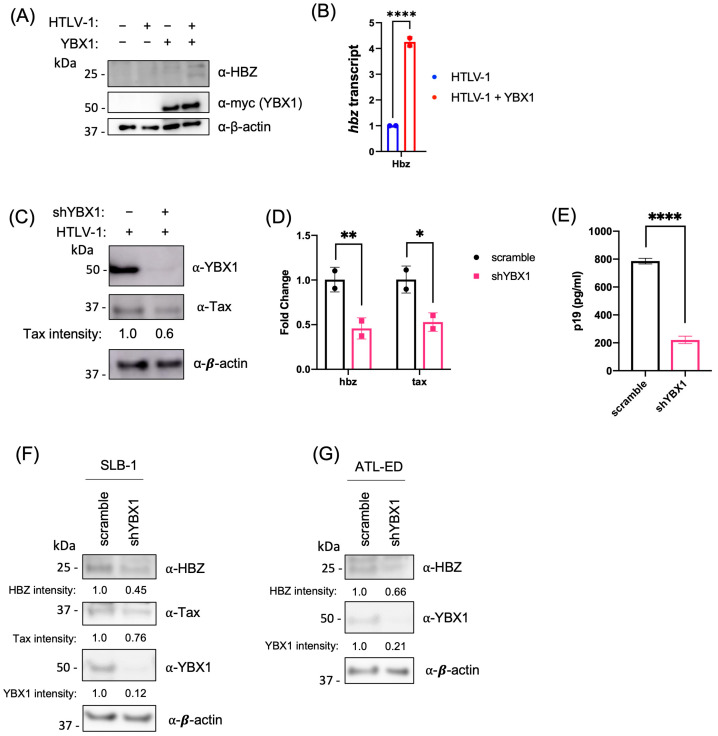
Figure 4.
YBX1 activates sense and antisense viral transcription. (A) HEK293T cells were co-transfected with an HTLV-1 proviral clone and a YBX1 expression plasmid, as indicated. Protein levels were examined 48 h post-transfection by immunoblot analysis using antibodies to HBZ, myc (YBX1), and β-actin. (B) Quantitative RT-PCR for hbz and gapdh was performed on mRNA isolated from cells in (A). The total hbz mRNA level was determined using the ΔΔCt method, normalized to relative gapdh levels, and the HTLV-1 provirus alone was set at 1. (C) HEK293T scramble and shYBX1 cells were transfected with an HTLV-1 proviral clone for 48 h. Protein levels were examined by immunoblot analysis using antibodies to Tax, YBX1, and β-actin. Tax protein intensity relative to β-actin without YBX1 knockdown was set at 1. (D) Quantitative RT-PCR for hbz, tax, and gapdh was performed on mRNA isolated from cells in (C). Total hbz and tax mRNA levels were determined using the ΔΔCt method, normalized to relative gapdh levels, and control cells (scramble) were set at 1. (E) HTLV-1 gene expression was quantified from cells in (C) through the detection of the p19 Gag protein in the culture supernatant using ELISA. (F) SLB-1 and (G) ATL-ED transformed T-cell lines were transduced with lentiviral vectors expressing shRNA directed against YBX1. After a brief puromycin selection, cells were collected and analyzed by immunoblot using antibodies to Hbz, Tax, YBX1, and β-actin. Tax and Hbz protein intensity relative to β-actin in each scramble condition was set at 1. All graphs represent data generated from duplicate samples, and error bars represent the standard deviation (SD). The data are representative of at least three experimental repeats. Statistical significance was determined using Student’s t-test: * p ≤ 0.05, ** p ≤ 0.01, **** p ≤ 0.0001.

