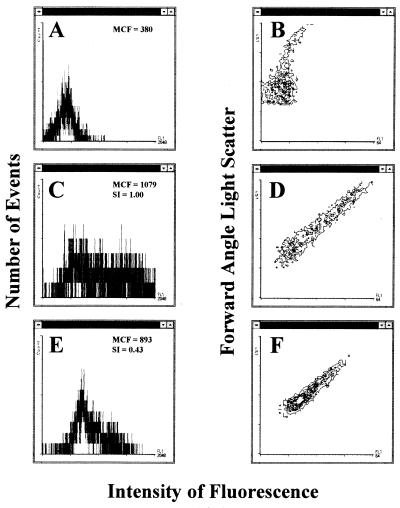
FIG. 1.
Intensity of fluorescence versus number of events (A, C, and E) and forward angle light scatter (B, D, and F) displayed as histogram or contour plot profiles, respectively, for M. tuberculosis organisms incubated for 24 h with (E and F) or without (C and D) 5.0 μg of INH/ml and then exposed to FDA. Other controls included M. tuberculosis organisms not incubated with INH or exposed to FDA (A and B). The mean channel fluorescence (MCF) values (the mean of the logarithmic intensity of fluorescence) of M. tuberculosis organisms with or without incubation with INH and exposed to FDA were used to calculate the susceptibility indices (SI). An index value of less than 0.75 suggested that M. tuberculosis organisms hydrolyzed less FDA than the drug-free control.

