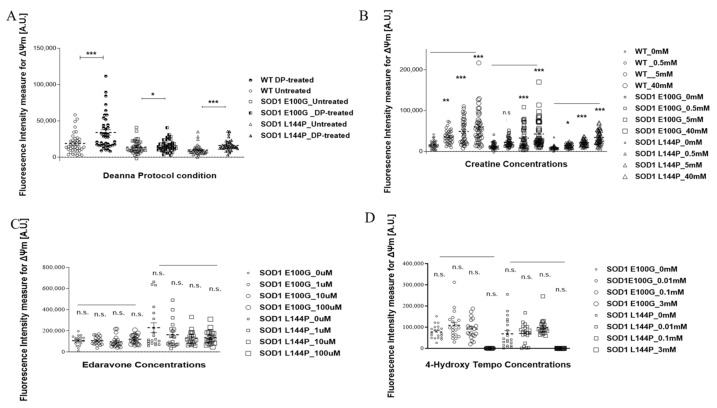
Figure 2.
Scatter plots of the average inner mitochondrial membrane potential by TMRE measurement of SOD1 and WT hSKM after treatment with (A) Deanna Protocol (DP), (B) Creatine, (C) Edaravone, and (D) 4-Hydroxy Tempo (Tempol). TMRE signal was measured in and reported for fluorescent intensity. Error bars: SEM * p < 0.1, ** p < 0.01, *** p < 0.001, n.s. = not significant.

