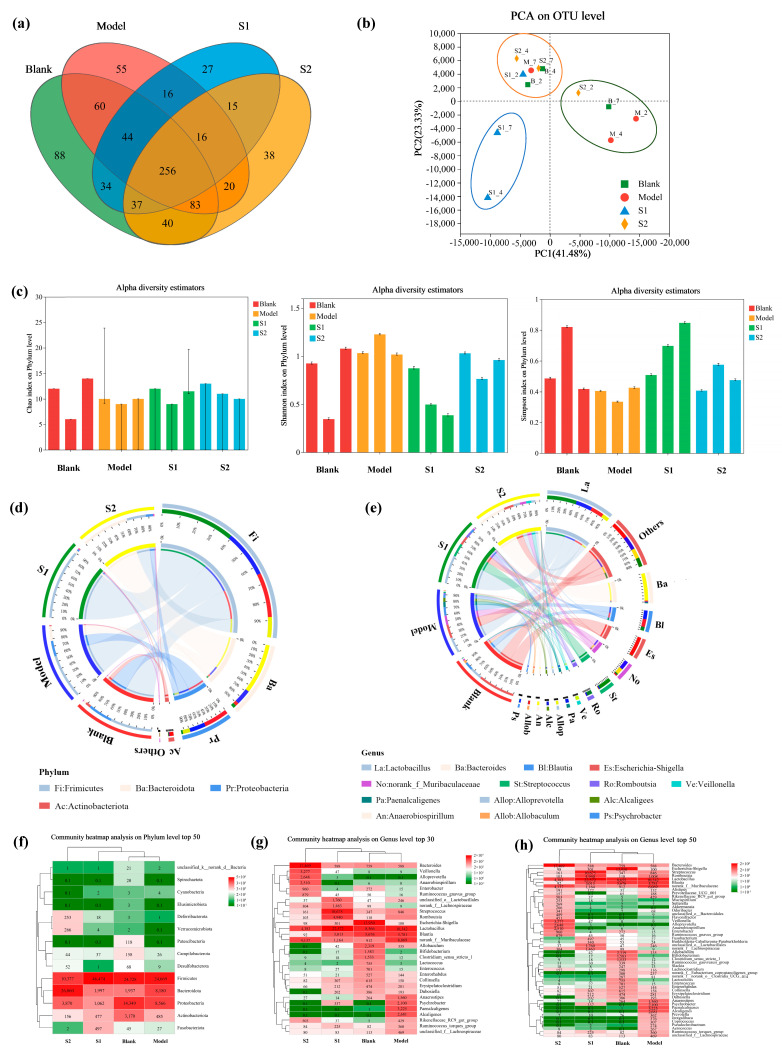
Figure 3.
Venn diagram (a), principal component analysis (PCA) (b), and the alpha diversity index (c) of the intestinal microflora of different XOS treatment groups. Visualization circle diagram of the relationship between samples and species (d,e). Heatmaps of sample community composition on day 7 (f–h). Phylum level (d,f); genus level (e,g,h).

