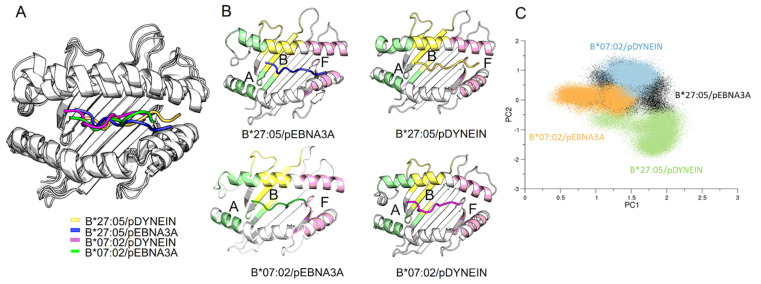
Figure 6.
Binding groove and peptide conformations. (A) Superimposition of the averaged structures of the binding grooves for the systems in the study. (B) The averaged structures are displayed separately, and the binding groove pockets are shown with A pocket in green, B pocket in yellow and F pocket in pink. (C) Principal component analysis of the binding grooves.

