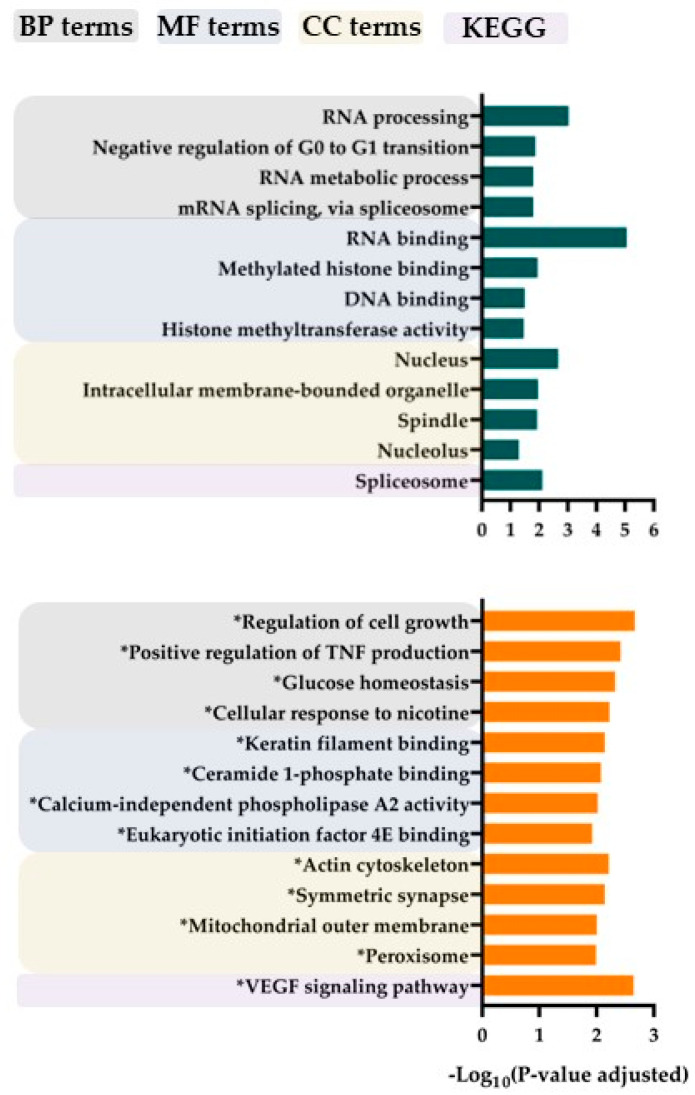
Figure 4.
A comparison of the global primary AML cell phosphoproteome for leukemic cells characterized by either a strong antiproliferative effect of bafilomycin A1 10 nM (eight patients, relative response ≤ 0.30) or a weak effect (seven patients, ≥0.60). GO analyses of differentially expressed phosphorylation sites showing significantly increased levels for AML cells/patients showing strong antiproliferative effects of bafilomycin are presented on (upper part, dark green color), the results for AML patients/cells showing weak effects are presented on the (lower part, orange color). These analyses were based on biological processes (BP), molecular functions (MF), cell compartment (CC) and KEGG classification, as indicated at the (top) of the figure (* indicates that the term reached statistical significance according to an uncorrected p-value).

