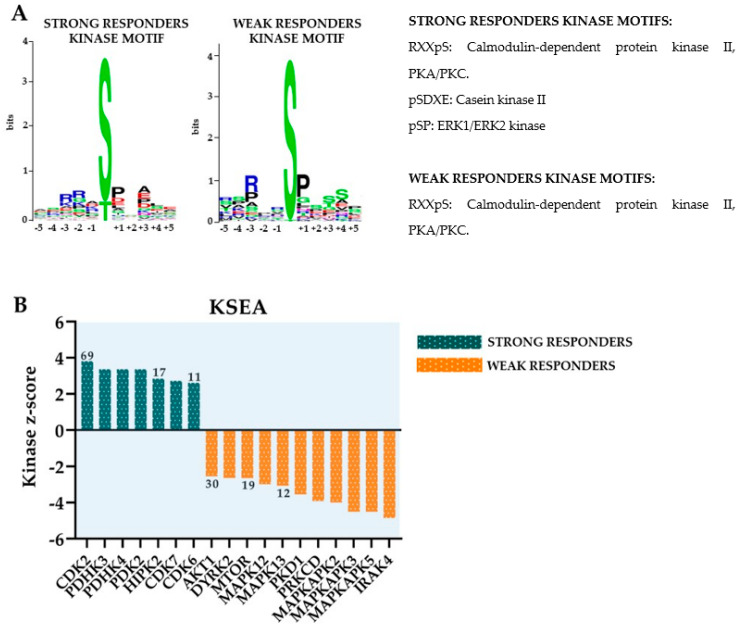
Figure 5.
A comparison of the global primary AML cell phosphoproteome for AML cells characterized by either a strong antiproliferative effect of bafilomycin A1 10 nM (eight patients, relative response ≤ 0.30) or a weak effect (seven patients, relative responses ≥ 0.60); the results from sequence motif analyses and kinase substrate enrichment analyses (KSEA). (A) The figure presents the results from sequence motif analyses (the letters in the kinase motifs indicate amino acid identity, size of the letter indicates the relative strength of the association) for AML cells/patients showing strong (left part) and weak (right part) antiproliferative effects of bafilomycin A1. The most significant kinase motifs are indicated to the right in the figure. (B) KSEA of differentially regulated phosphorylation sites. The kinase z-score (y axis) is the normalized score for each kinase (x axis), weighted by the number of identified substrates. Numbers close to the bars indicated the number of substrates; this is only shown for kinases with at least 10 substrates.

