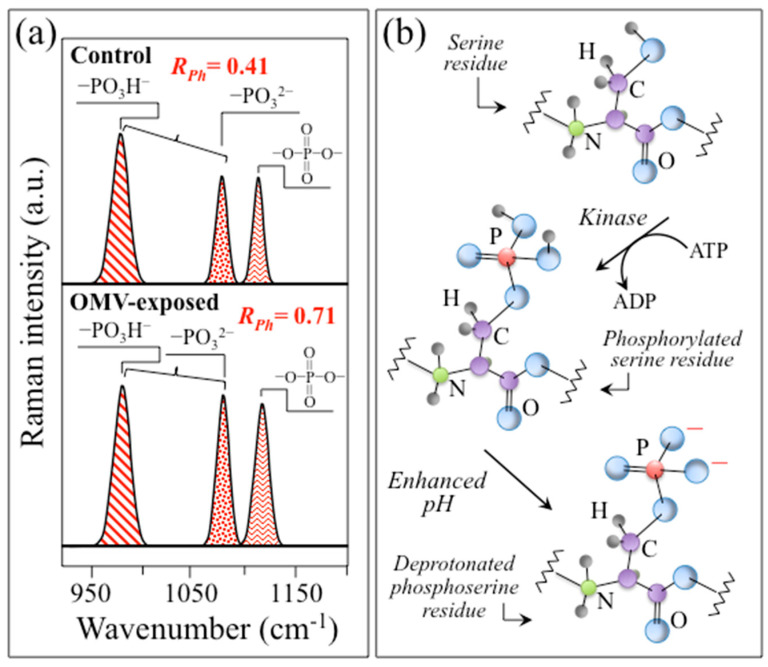
Figure 9.
(a) Selected phosphate-related Raman signals as extracted from the spectra of the control SH-SY5Y (upper) and the Pg-OMV-exposed SH-SY5Y (lower) cell cultures shown in Figure 7a,b, respectively. Three characteristic stretching bands were selected and compared, which belong to: polyphosphates at ~1112 cm−1, dibasic phosphates at 1080 cm−1, and monobasic phosphates at 978 cm−1 (cf. the respective computed RPh = I1080/I978 ratios, inset); in (b), mechanism of relative fractional increase in–OPO32− and O=P=O bonds and their effect on serine residues.

