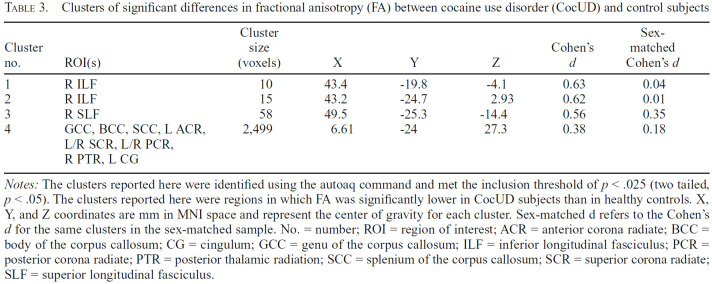
Table 3.
Clusters of significant differences in fractional anisotropy (FA) between cocaine use disorder (CocUD) and control subjects
| Cluster no. | ROI(s) | Cluster size (voxels) | X | Y | Z | Cohen's d | Sex-matched Cohen's d |
|---|---|---|---|---|---|---|---|
| 1 | RILF | 10 | 43.4 | -19.8 | -4.1 | 0.63 | 0.04 |
| 2 | RILF | 15 | 43.2 | -24.7 | 2.93 | 0.62 | 0.01 |
| 3 | R SLF | 58 | 49.5 | -25.3 | -14.4 | 0.56 | 0.35 |
| 4 | GCC, BCC, SCC, L ACR, L/R SCR, L/R PCR, R PTR, L CG | 2,499 | 6.61 | -24 | 27.3 | 0.38 | 0.18 |
Notes: The clusters reported here were identified using the autoaq command and met the inclusion threshold of p < .025 (two tailed, p < .05). The clusters reported here were regions in which FA was significantly lower in CocUD subjects than in healthy controls. X, Y, and Z coordinates are mm in MNI space and represent the center of gravity for each cluster. Sex-matched d refers to the Cohen's d for the same clusters in the sex-matched sample. No. = number; ROI = region of interest; ACR = anterior corona radiate; BCC = body of the corpus callosum; CG = cingulum; GCC = genu of the corpus callosum; ILF = inferior longitudinal fasciculus; PCR = posterior corona radiate; PTR = posterior thalamic radiation; SCC = splenium of the corpus callosum; SCR = superior corona radiate; SLF = superior longitudinal fasciculus.

