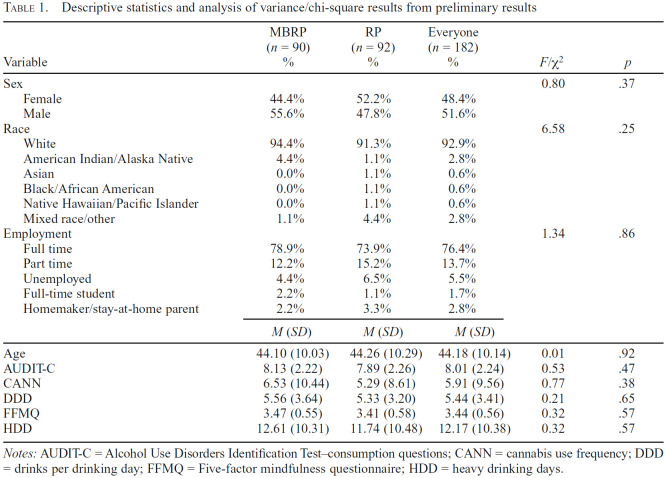
Table 1.
Descriptive statistics and analysis of variance/chi-square results from preliminary results
| Variable | MBRP (n = 90) % | RP (n = 92) % | Everyone (n = 182) % | F/χ 2 | p |
|---|---|---|---|---|---|
| Sex | 0.80 | .37 | |||
| Female | 44.4% | 52.2% | 48.4% | ||
| Male | 55.6% | 47.8% | 51.6% | ||
| Race | 6.58 | .25 | |||
| White | 94.4% | 91.3% | 92.9% | ||
| American Indian/Alaska Native | 4.4% | 1.1% | 2.8% | ||
| Asian | 0.0% | 1.1% | 0.6% | ||
| Black/African American | 0.0% | 1.1% | 0.6% | ||
| Native Hawaiian/Pacific Islander | 0.0% | 1.1% | 0.6% | ||
| Mixed race/other | 1.1% | 4.4% | 2.8% | ||
| Employment | 1.34 | .86 | |||
| Full time | 78.9% | 73.9% | 76.4% | ||
| Part time | 12.2% | 15.2% | 13.7% | ||
| Unemployed | 4.4% | 6.5% | 5.5% | ||
| Full-time student | 2.2% | 1.1% | 1.7% | ||
| Homemaker/stay-at-home parent | 2.2% | 3.3% | 2.8% | ||
| M (SD) | M (SD) | M (SD) | |||
| Age | 44.10 (10.03) | 44.26 (10.29) | 44.18 (10.14) | 0.01 | .92 |
| AUDIT-C | 8.13 (2.22) | 7.89 (2.26) | 8.01 (2.24) | 0.53 | .47 |
| CANN | 6.53 (10.44) | 5.29 (8.61) | 5.91 (9.56) | 0.77 | .38 |
| DDD | 5.56 (3.64) | 5.33 (3.20) | 5.44 (3.41) | 0.21 | .65 |
| FFMQ | 3.47 (0.55) | 3.41 (0.58) | 3.44 (0.56) | 0.32 | .57 |
| HDD | 12.61 (10.31) | 11.74(10.48) | 12.17 (10.38) | 0.32 | .57 |
Notes: AUDIT-C = Alcohol Use Disorders Identification Test–consumption questions; CANN = cannabis use frequency; DDD = drinks per drinking day; FFMQ = Five-factor mindfulness questionnaire; HDD = heavy drinking days.

