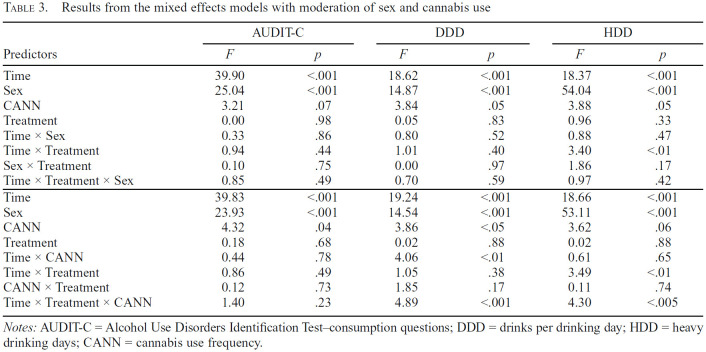
Table 3.
Results from the mixed effects models with moderation of sex and cannabis use AUDIT-C DDD HDD
| Predictors | AUDIT-C | DDD | HDD | |||
|---|---|---|---|---|---|---|
| F | p | F | p | F | p | |
| Time | 39.90 | <.001 | 18.62 | <.001 | 18.37 | <.001 |
| Sex | 25.04 | <.001 | 14.87 | <.001 | 54.04 | <.001 |
| CANN | 3.21 | .07 | 3.84 | .05 | 3.88 | .05 |
| Treatment | 0.00 | .98 | 0.05 | .83 | 0.96 | .33 |
| Time × Sex | 0.33 | .86 | 0.80 | .52 | 0.88 | .47 |
| Time × Treatment | 0.94 | .44 | 1.01 | .40 | 3.40 | <.01 |
| Sex × Treatment | 0.10 | .75 | 0.00 | .97 | 1.86 | .17 |
| Time × Treatment × Sex | 0.85 | .49 | 0.70 | .59 | 0.97 | .42 |
| Time | 39.83 | <.001 | 19.24 | <.001 | 18.66 | <.001 |
| Sex | 23.93 | <.001 | 14.54 | <.001 | 53.11 | <.001 |
| CANN | 4.32 | .04 | 3.86 | <.05 | 3.62 | .06 |
| Treatment | 0.18 | .68 | 0.02 | .88 | 0.02 | .88 |
| Time × CANN | 0.44 | .78 | 4.06 | <.01 | 0.61 | .65 |
| Time × Treatment | 0.86 | .49 | 1.05 | .38 | 3.49 | <.01 |
| CANN × Treatment | 0.12 | .73 | 1.85 | .17 | 0.11 | .74 |
| Time × Treatment × CANN | 1.40 | .23 | 4.89 | <.001 | 4.30 | <.005 |
Notes: AUDIT-C = Alcohol Use Disorders Identification Test–consumption questions; DDD = drinks per drinking day; HDD = heavy drinking days; CANN = cannabis use frequency.

