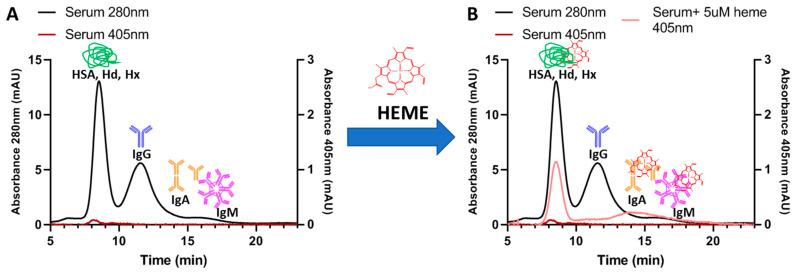
Figure 6.
Application of an HF5-based platform as a tool for evaluating the selective interactions of components (heme) in a complex matrix (whole serum). (A). The fractogram shows the profiles of separated serum components at two wavelengths: 280 nm (protein specific) and 405 nm (heme-specific). (B). The 405 nm signal, registered after spiking serum with heme, simulating hemolysis, suggests the preferential binding of heme to HSA, Hd, and Hx. Binding to IgA and IgM has also been observed. Image adapted from [98].

