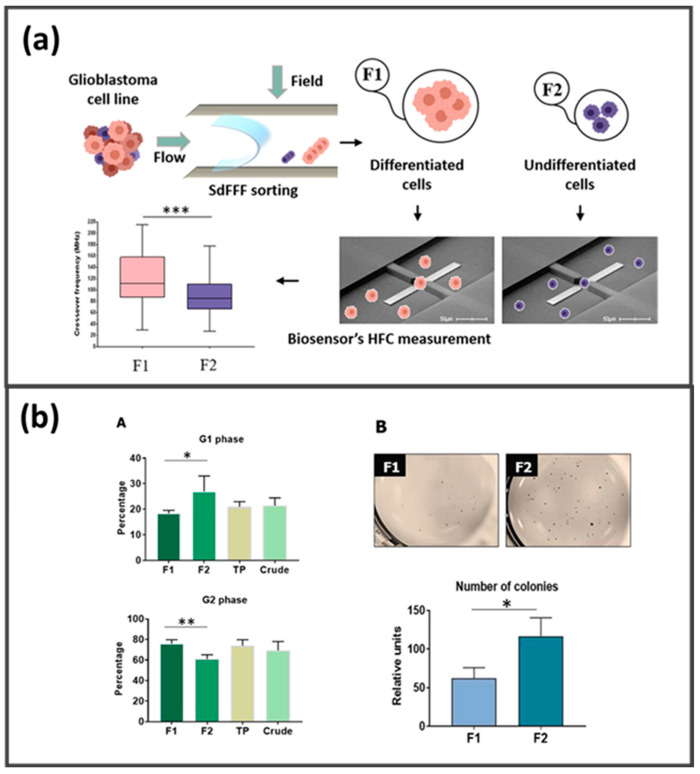
Figure 9.
(a) SdFFF sorting scheme of glioblastoma cell lines: F1 = subpopulations with specific differentiation characteristics; F2 = cancer stem cells (CSCs) and high-frequency crossover (HFC) values. (b) Functional characterization of F1, F2, total peak collected (TP), and unfractionated cells (crude). *** p < 0.0001 (ANOVA). (A) Cell cycle analysis by DNA content measurement: CSCs (F2) are found in the G1 phase (quiescent cells). (B) Soft agar assay for colony formation examination: the F2 subpopulation consists of a population of cells enriched in CSCs, whereas the F1 subpopulation is enriched in differentiated cells. * p < 0.05; ** p < 0.001 (Student’s t test). Images adapted from [242].

