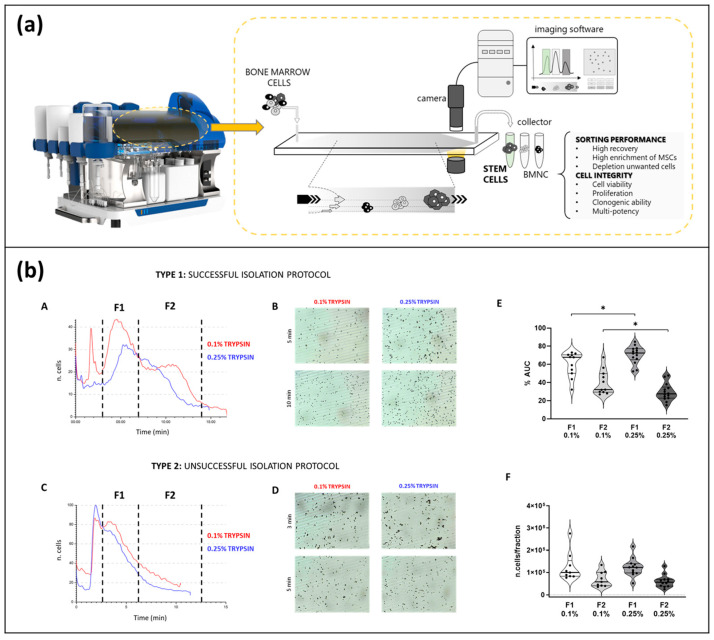
Figure 10.
(a) A schematic representation of Celector®: cells are injected into the inlet of the separation channel filled with mobile phase and eluted through it, acquiring different velocities related to their physical properties. A camera connected to the imaging software that plots the number of counted cells vs. time (fractogram) visualizes cells. Finally, cells are collected at the outlet and divided into different tubes according to the sample’s fractogram. Images are adapted from [249] and published with permission. (b) Representative images of a successful isolation protocol of amniotic epithelial cells (AECs) (Type 1) and an unsuccessful (Type 2) protocol. The profile represents the number of cells versus time of analysis (A,C) and collected subpopulations F1 and F2; live images of eluting cells (B,D); cell distribution between F1 and F2 based on the calculation of the area under the curve (AUC) expressed as a percentage compared to the total area of the profile (E); distribution was also expressed as a number of counted cells by the software for each fraction of all samples analyzed (F). (t-test: p < 0.05 *.) Images are adapted from [249,250] and published with permission.

