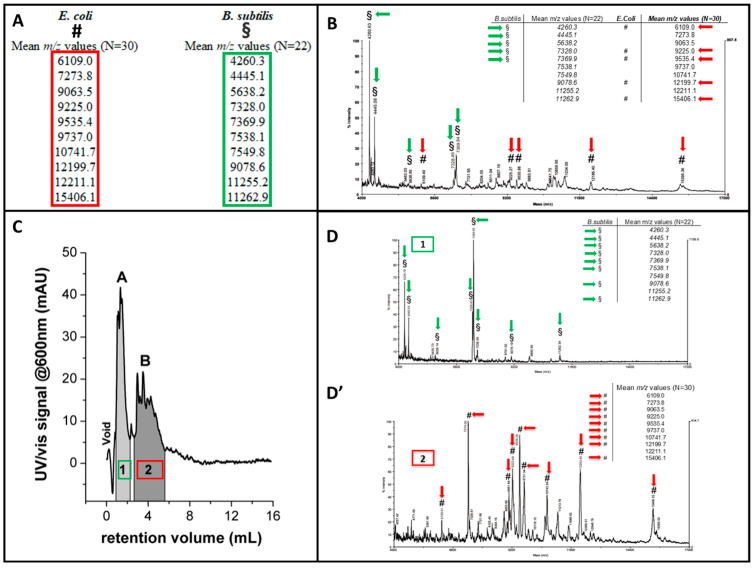
Figure 11.
An example of an HF5 platform coupled offline with a MALDI/TOF detection system used to separate and characterize different cell subtypes. (A). Characteristic MALDI/TOF MS peaks of E. coli (§, green) and B. subtilis (#, red). (B). A MALDI/TOF MS spectrum of a mixture of the two species without HF5 separation. Five characteristic peaks were identified for boot species. (C). A fractogram of the same mixture separated through HF5. Two fractions were collected (namely 1 and 2). (D,D′) A MALDI/TOF MS spectrum of the collected fractions after a concentration process. The comparison with the characteristic peaks for both species allowed the identification of Fraction 1 as B. subtilis and Fraction 2 as E. coli. A higher number of characteristic peaks was observed for both species after HF5 separation. Images are adapted from [267].

