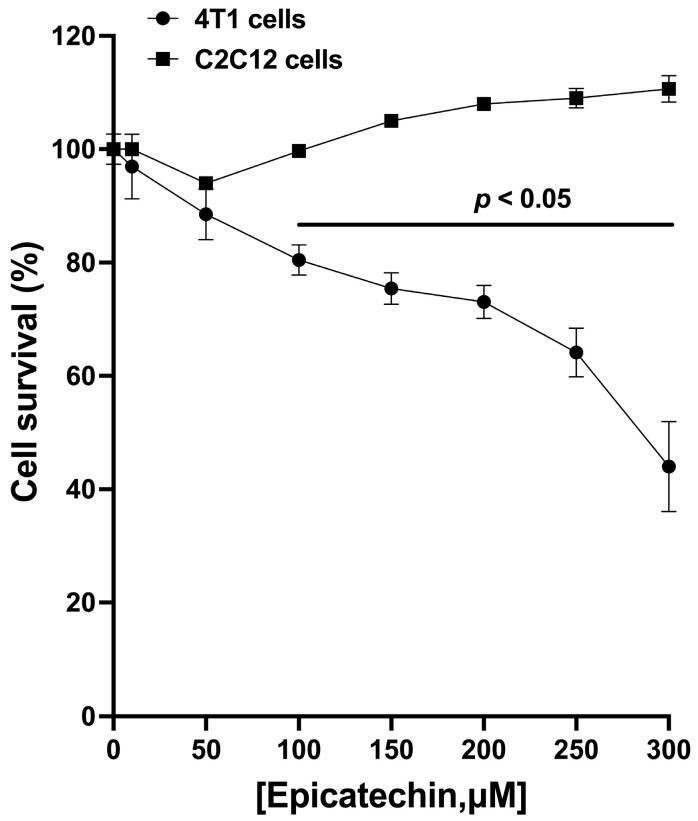
Figure 1.
Tumor cell survival inhibition curve (4T1, circles) at different (−)-epicatechin concentrations. The most significant effect was achieved with 300 μM EC. The presence of EC in the culture of non-tumor cells (myoblasts C2C12, squares) did not cause a decrease in cell survival. Results are represented as the mean ± standard error of the mean (SEM). Experiments were performed in triplicate in at least two independent assays.

