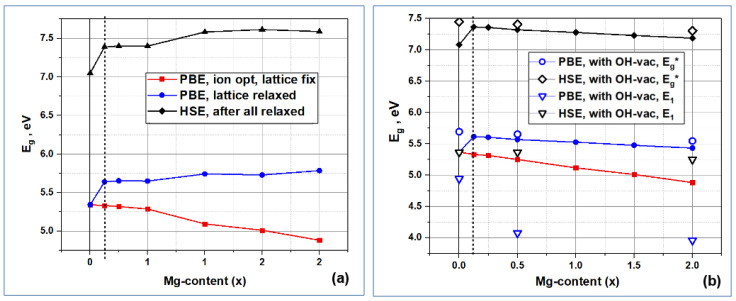
Figure 10.
Change in the band gap Eg upon substitutions nMg/Ca in different positions of the calcium atom Ca: (a) in Ca1 positions; (b) in Ca2 positions. The effect of OH vacancy (OH-vac) on the Eg → Eg* change is shown with points at selected concentrations x. We also show the energy E1 = Ei − EV (E1 = Ei − E_HOMO), which is the energy distance from valence band top to the defect energy level in the band gap.

